3 Ways Data Visualization Can Benefit Your Business
Are you looking to transform decision making within your organization and help your business grow? Her are 3 key business benefits of data visualization.
As your business accumulates more and more data, it becomes increasingly difficult to sort through all of the information for relevant insights. That’s why it becomes necessary to organize the evidence into larger datasets you can view at a glance, which is exactly why you need data visualization.
Data visualization has advanced considerably over the last few years, and instead of just simple graphs and charts, information can be used to create displays such as:
- Infographics
- Heat maps
- Geographic maps
- Fever charts
What does this mean? Today, data visualization not only makes data more understandable, but it also makes big data applications easier to work with.
Grow Your Calgary Business With Our Data VIsualization Services
With years of experience and a wide range of tools at our disposal, Cadeon is well positioned to meet all of your data visualization needs. In addition to extensive training, our team uses a whole range of technologies to help you see ‘the whole picture’
3 Incredible Business Benefits of Data Visualization
Data visualization (the representation of data in a pictorial or graphical format) allows decision makers and business owners to understand complex concepts, as well as identify new trends and patterns quickly and easily.
This has some key benefits for business growth because it:
1. Enables Swift Action
The human brain interprets visual information far more easily and quicker than written information. Using charts and graphs will therefore transform even the most complex data into something that is easy to view and understand.
Data visualization brings about simplification and transparency, which allows decision makers to:
- Comprehend the information faster and more efficiently
- Take meaningful actions swiftly.
- Utilize real time information to make decisions that affect the business effectively.
- Adapt and respond well to market changes
All in all, data visualization will allow you, as a business owner, to identify new opportunities and stay ahead of the competition in your industry.
2. Helps Organizations Identify Key Business Trends
There is an abundance of large and valuable databases available to businesses today. However, if they are not harnessed and used efficiently, then they quickly become pointless. Sales and marketing teams who use data visualization will be able to understand their customers more and create campaigns which will resonate with them.
In fact, data visualization will allow businesses to:
- Identify trends and gauge performance of their trade promotions.
- Gain visibility into which products, promotions, and services are not working well.
- Identify and segment plans with accuracy to deliver business outcomes that are in line with their company goals.
Data visualization provides users with a swift and easily accessible way to identify important patterns. This will allow your sales and marketing team to make fast decisions in a competitive environment, and stay ahead of the curve.
3 It Allows For Direct and Customized Interaction With Data
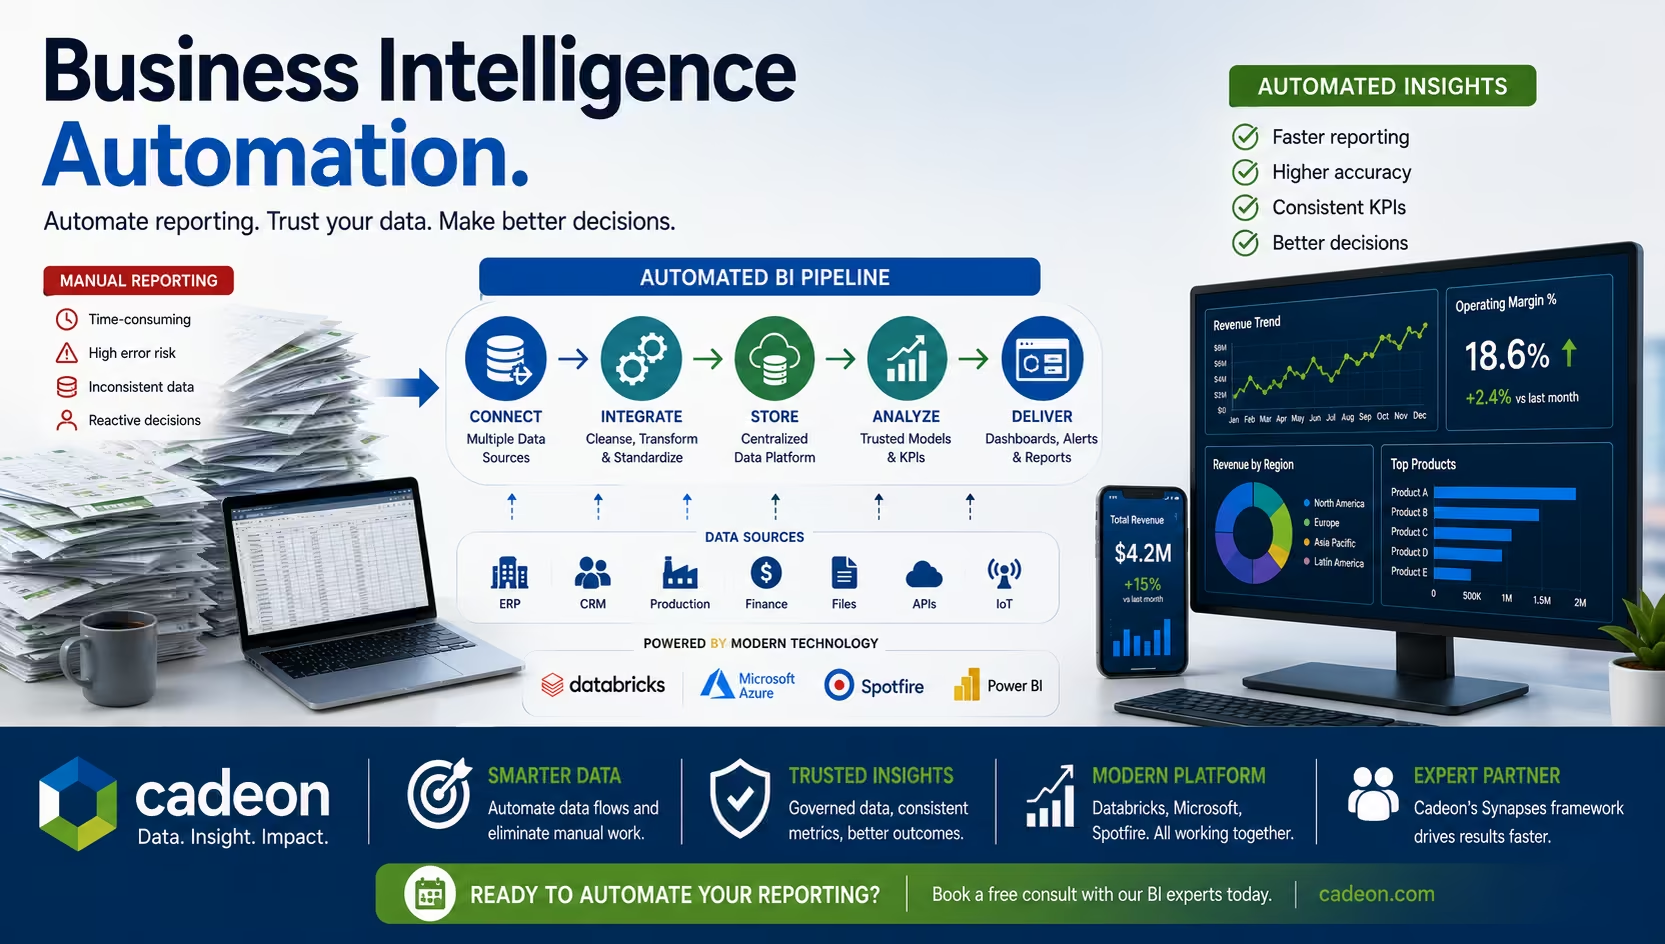
One of the key benefits of data visualization is that when powered by seamless data pipeline integration, it allows companies to generate customized reports and interact with data in a direct way. This enables decision-makers to gain actionable insights. Unlike static spreadsheets or tables, these integrated visualization tools offer active, real-time interaction rather than just passive viewing.
Call Today
Do you want to stand out from your competition and take your business to new heights? To learn more about our data visualization services and how our team can help gain more actionable insights from your data, contact us at (403) 475-2494 or fill out our online contact form.
No items found.
Ready to transform your data strategy?
You might also like
.png)
AI As a Paradigm Shift
Here’s something our team has been talking about. If your organization is investing in AI—pilots, platforms, use cases—but somehow the results still feel incremental instead of transformative, then keep reading.
What Is Data Integration? Methods, Tools, and BI Explained