
Improve Analytics ROI With Faster, More Efficient Reporting
Get more value from the analytics systems you already use. Cadeon helps reduce dashboard delays, repeated data checks, and manual reporting work. We identify performance bottlenecks, prioritize practical fixes, and measure the results against your current costs and reporting effort.


KPI Definitions and Reporting Logic
Resolve differences in how teams calculate the same metric. Review source mappings, formulas, and reporting periods to reduce reconciliation work and make recurring reports easier to verify.
Dashboard Performance Optimization
Investigate slow queries, heavy calculations, and dashboard design issues. Tune the parts that delay loading, filtering, and drilldowns so users can explore their data with fewer interruptions.

Data Refresh and Reporting Automation
Improve delayed refresh cycles and repetitive report preparation. Our reporting automation services help reduce manual exports, copying, and formatting within existing reporting workflows.
Analytics Cost and Usage Review
Compare tool and processing costs with actual report usage. Identify duplicate dashboards, unnecessary refreshes, and low-value reporting work so teams can make better decisions about analytics spending.
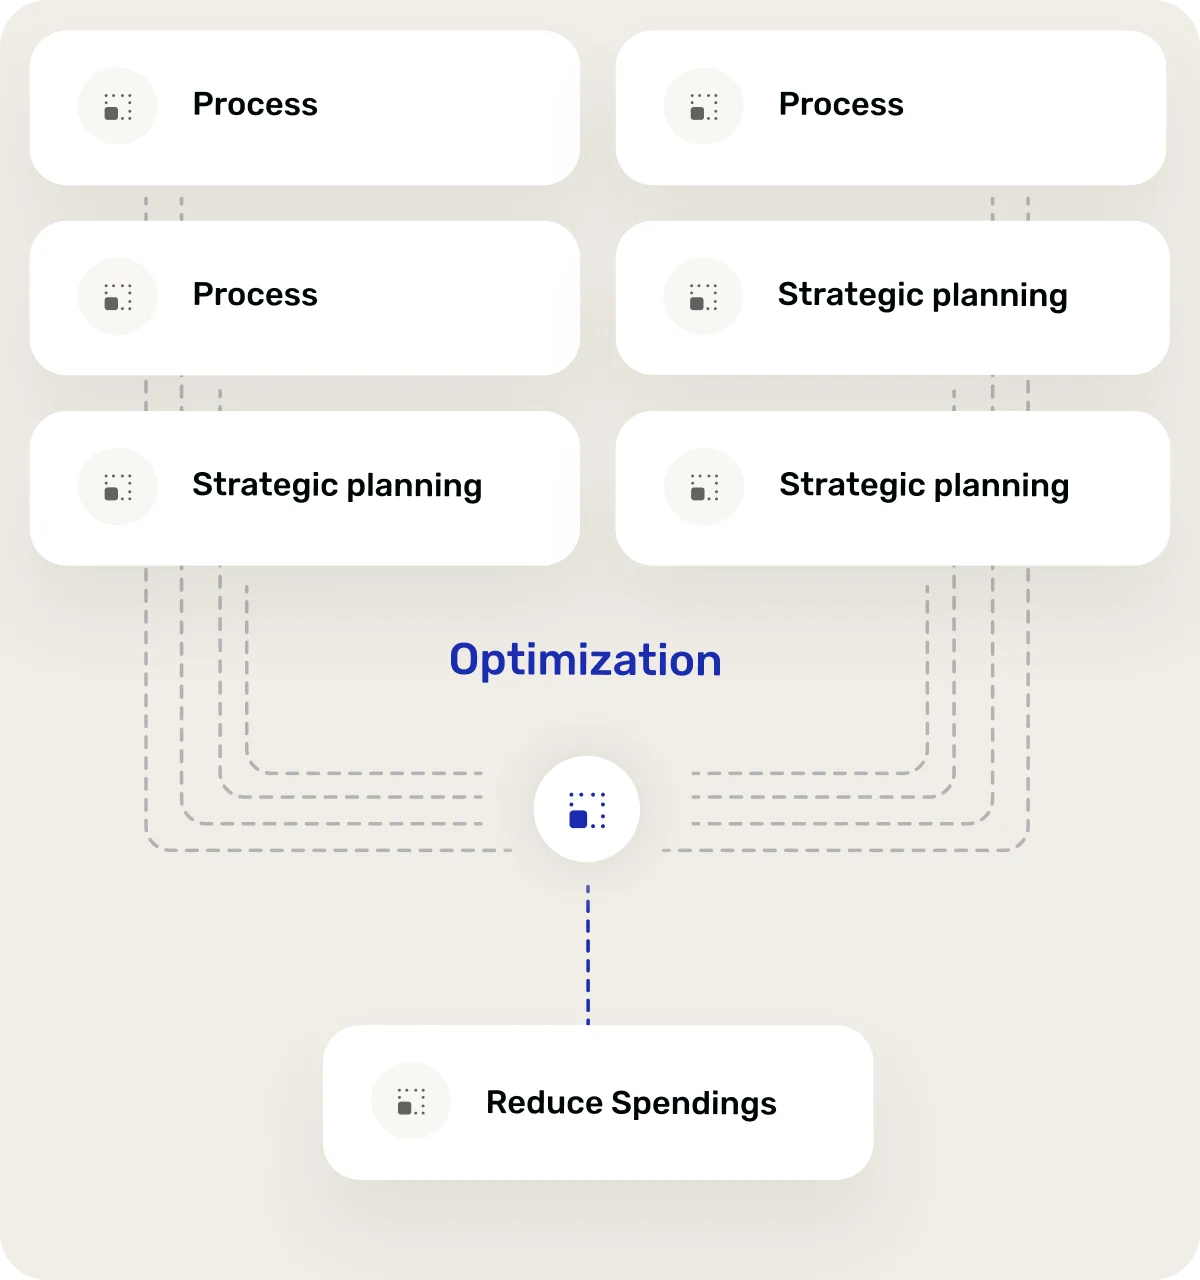

Measure Analytics ROI Against a Clear Baseline
Fewer reconciliations once KPI rules and source logic are cleaned up.
Heavy queries and slow refresh patterns get reworked for speed.
Less manual pulling, copying, and formatting across recurring reporting cycles.

Start With the Highest-Cost Problems
Identify the delays and repetitive tasks affecting the most users or consuming the most time. Prioritize improvements by their likely value and the effort required.
Improve What Already Works
Review the current setup before recommending replacements. Keep useful reports and data connections, and focus changes on the components limiting their speed, accuracy, or value.
Check Results Against the Baseline
Compare agreed measures before and after implementation. Review reporting effort, dashboard response times, and operating costs to see which changes delivered a measurable improvement.
Make Improvements Easier to Maintain
Document revised calculations, refresh settings, and reporting logic. Give the people managing your analytics a clear record of what changed and what needs ongoing attention.
Is Your Reporting Setup Due for a Performance Review?
Recurring workarounds often reveal where analytics value is being lost. If these problems affect your team, a focused review can help identify the causes and establish which improvements are worth pursuing.
Users Work Around Slow Dashboards
Teams export data or stop opening reports because loading and filtering take too long. Review the dashboards involved, how often they are used, and where delays occur.
Check Results Against the Baseline
Compare agreed measures before and after implementation. Review reporting effort, dashboard response times, and operating costs to see which changes delivered a measurable improvement.
Key Processes Depend on One Person
A report stalls when its owner is unavailable because preparation steps or calculations are undocumented. Review those dependencies and make the process easier for others to maintain.

Reports Arrive Too Late to Use
Long refresh windows, heavy queries, and manual preparation can push reports past the point when teams need them. We combine dashboard performance optimization with workflow improvements to reduce avoidable delays.
Teams Keep Rechecking the Same Metrics
Different source rules and calculation methods leave teams debating which figure is correct. We align definitions and reporting logic so reviewers can explain differences and spend less time repeating the same checks.
Find the Next Improvement in Your Analytics ROI
Bring us the reports that take too long, dashboards people avoid, or recurring tasks consuming your team’s time. Cadeon will help assess the causes, prioritize practical changes, and define how to measure their value.

Frequently Asked Questions
What is analytics ROI, and how do you measure it?
Analytics ROI compares the measurable benefits of an analytics investment with its total costs over a defined period. Benefits may include verified cost reductions and the value of reduced reporting effort. Costs include implementation, software, infrastructure, and ongoing support. Cadeon helps establish a baseline and track changes, separating actual cash savings from staff time released for other work.
What do Cadeon's business intelligence optimization services include?
Cadeon's business intelligence optimization services cover dashboard performance, data refresh efficiency, KPI definitions, reporting workflows, and cost and usage reviews. We assess an existing setup, identify bottlenecks, and prioritize changes based on business impact and implementation effort. The scope depends on the tools involved and the reporting problems your team needs to resolve.
What are the signs that an analytics system needs optimization?
Common signs include slow dashboard loading, missed refresh windows, repeated spreadsheet exports, conflicting KPIs, and reports that few people use. Reporting processes that depend on one person can also create delays. A review helps identify the underlying causes and determine which improvements offer enough value to justify the work.
How does dashboard performance optimization work?
Dashboard performance optimization starts by measuring where users experience delays, such as opening a report, applying filters, or refreshing data. Cadeon reviews queries, data structures, calculations, and visualizations to identify the causes. After making changes, we compare performance under similar data volumes and usage conditions to assess the improvement.
Can consistent KPI definitions improve analytics ROI?
Yes. When departments calculate the same metric differently, teams spend time reconciling reports and explaining conflicting results. Agreeing on source data, calculation rules, and reporting periods can reduce that repeated work. Cadeon helps standardize these definitions and measure changes in reconciliation effort as part of the wider analytics ROI assessment.
Does Cadeon provide Spotfire performance optimization?
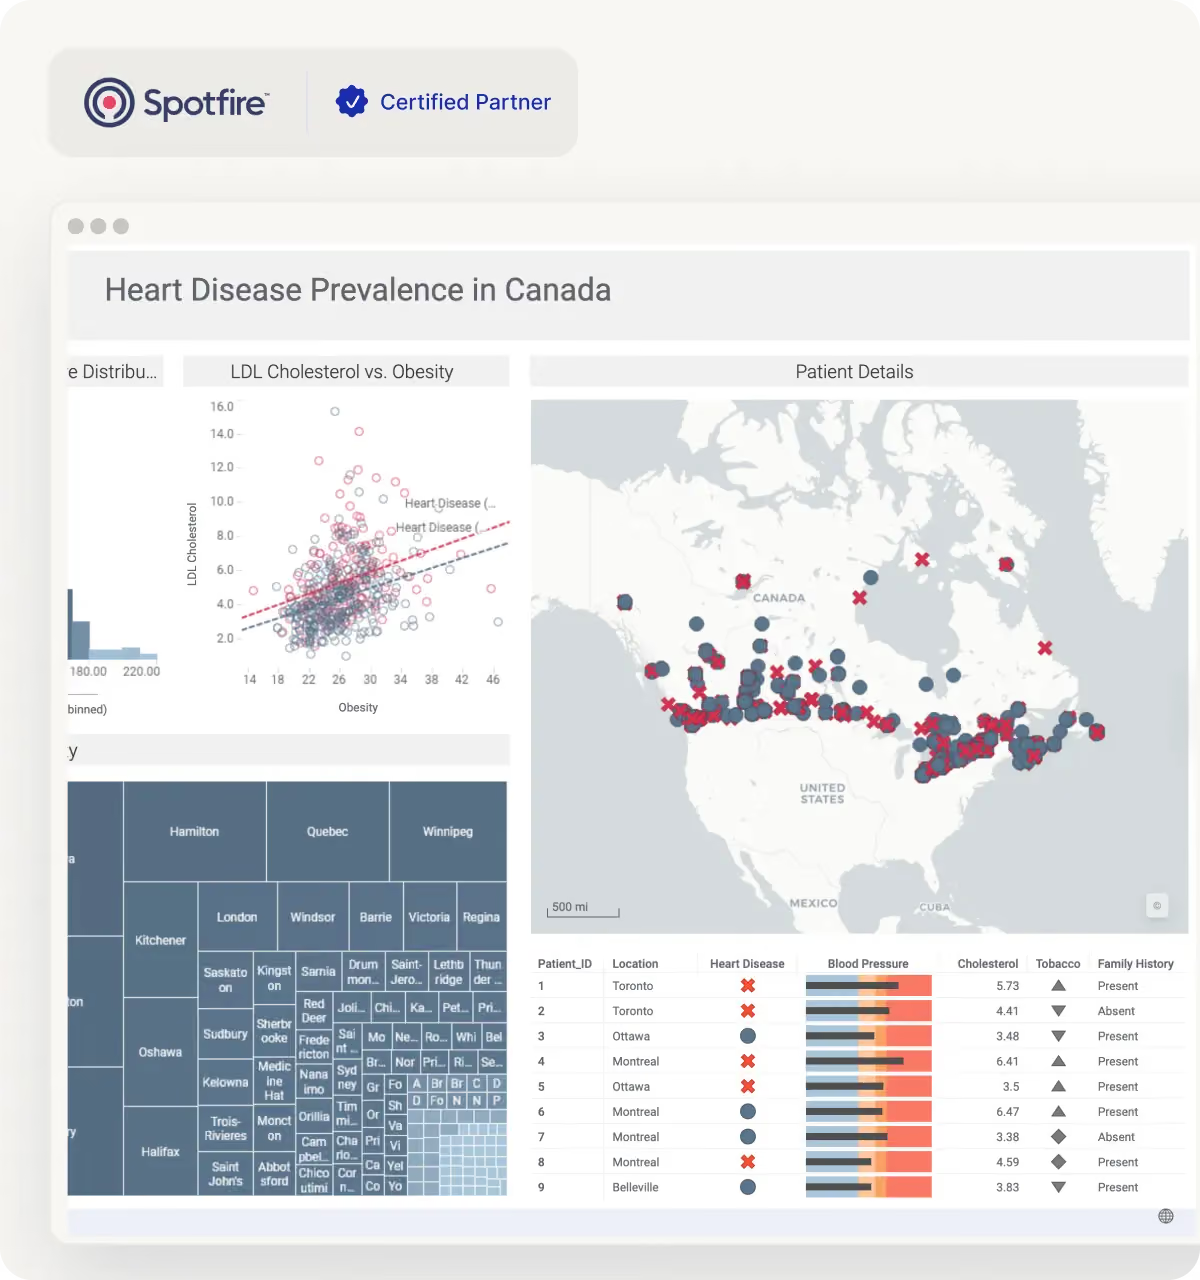
Yes. Cadeon reviews Spotfire data tables, calculations, visualizations, and refresh settings to identify performance bottlenecks. We focus on how users load, filter, and explore the dashboards they rely on. Improvements are assessed against a baseline so your team can see how the changes affect everyday reporting tasks.
How can reporting automation services reduce manual work?
Reporting automation services reduce repeatable tasks such as exporting data, combining files, applying standard calculations, and preparing recurring reports. Cadeon reviews these steps and automates suitable parts of the workflow, while keeping necessary checks and approvals. The aim is to reduce preparation effort without carrying existing data or reporting errors into an automated process.
Do we need to replace our analytics platform to improve performance?
Not necessarily. Slow reporting can come from inefficient queries, heavy calculations, duplicate processing, or poorly timed refreshes within an otherwise useful platform. Cadeon assesses the current setup before recommending changes. Where existing components can meet your needs, we focus on improving them; larger changes depend on the limitations found during the review.