
Utilities Data Analytics for Clearer Operational Decisions
Cadeon provides data analytics consulting for utilities, connecting operational records with Spotfire dashboards, maintenance insights, and automated reporting. We help utilities and energy operators track asset performance, investigate service issues, and reduce manual data preparation, with experience across utilities, upstream oil and gas, and drilling operations.

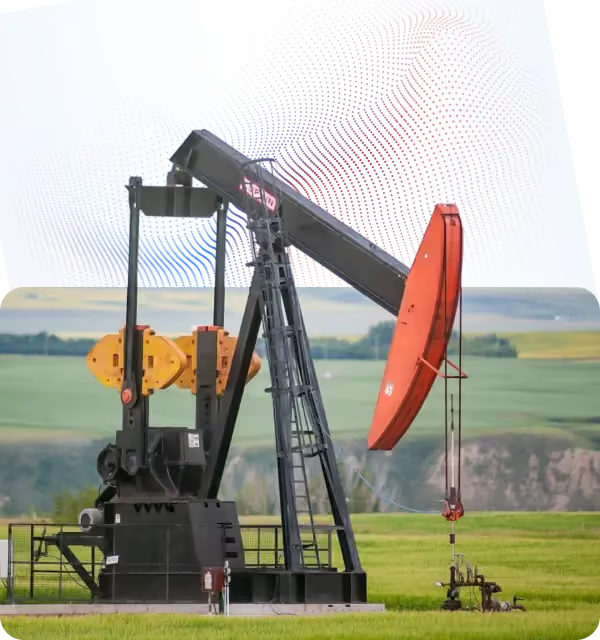
Operational Performance Dashboards
Track load, outages, reliability, and asset performance in shared dashboards. Bring current operational readings into reporting views, with refresh schedules matched to your source systems.
Utility Data Integration
Connect metering, GIS, ERP, and maintenance records through reliable data pipelines. Align asset identifiers and reporting fields so teams can compare information across systems with fewer manual checks.

Predictive Maintenance Analytics
Combine asset history, condition readings, and maintenance records to identify warning patterns. Help teams assess equipment risk and prioritize inspections using the available operational evidence.
Traceable Compliance Reporting
Prepare recurring reports using consistent calculations and clear links to source data. Reduce manual compilation and help reviewers explain reported figures during internal checks and audit preparation.
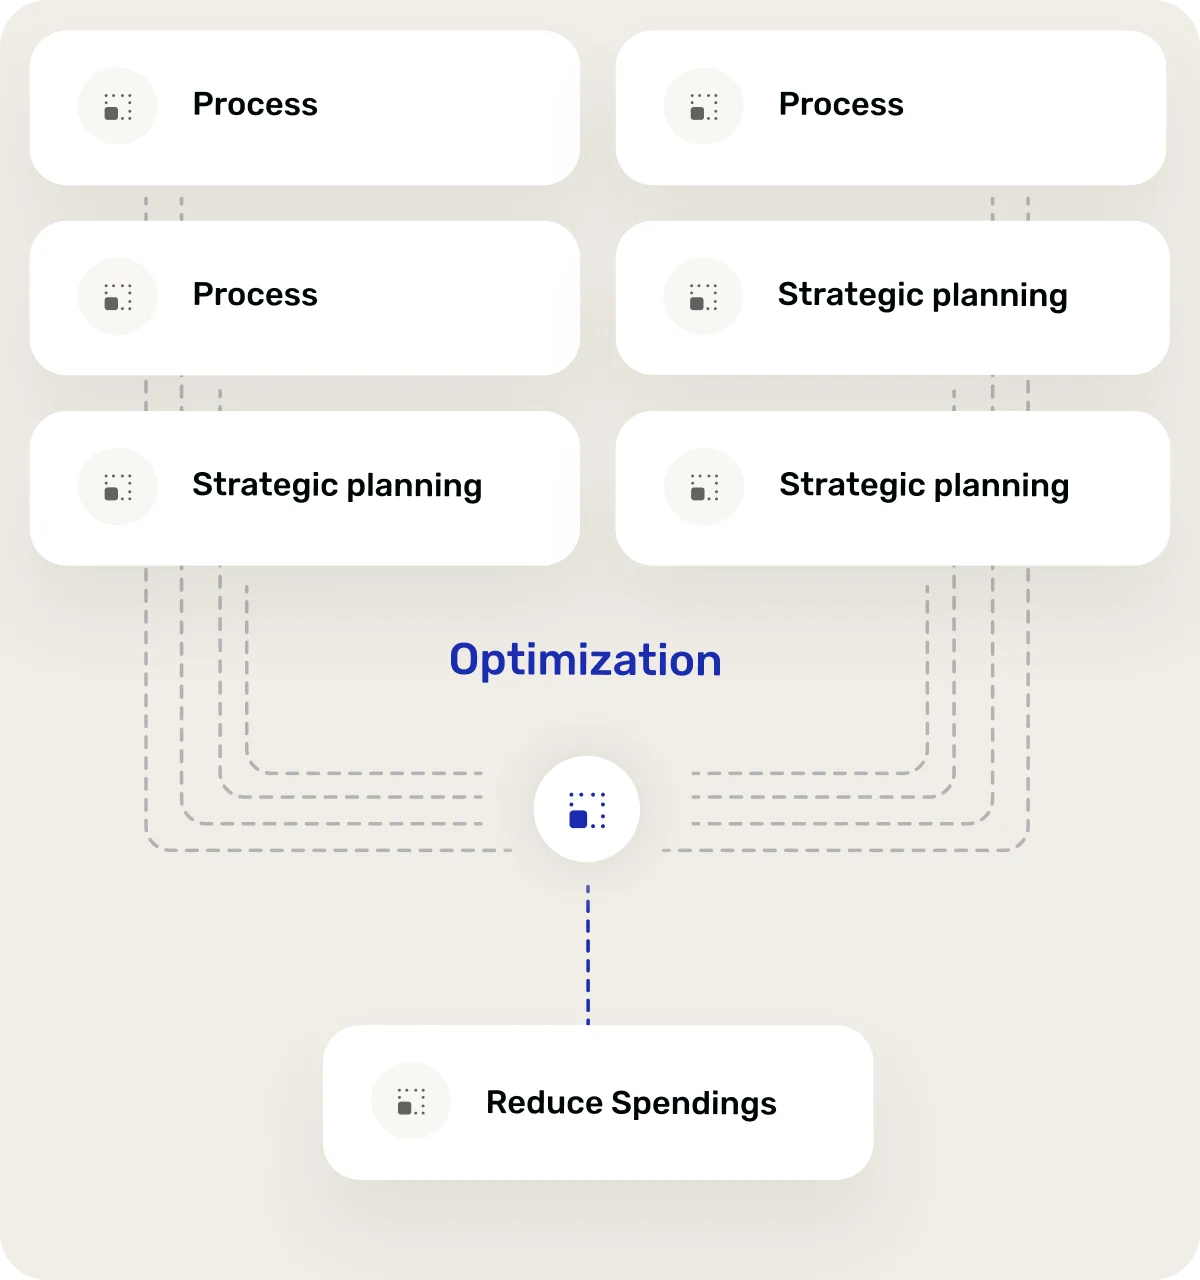

Results You Can Measure
Track how long it takes to prepare recurring operational reports, from collecting source records to completing the final review.
Measure missing records and conflicting KPI values to see where data quality work reduces repeated checks across teams.
Monitor the time needed to connect a performance change with the relevant asset readings, events, and maintenance history.
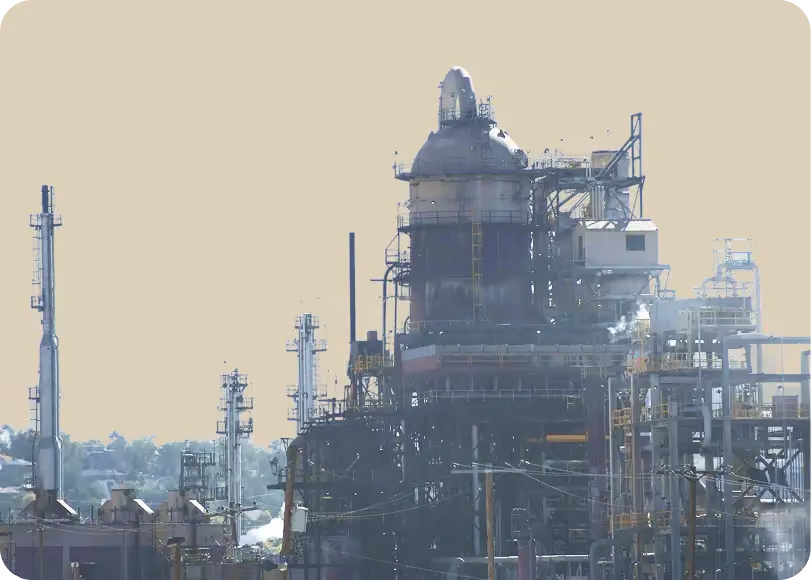

Connected Utility Systems
Bring SCADA, metering, GIS, ERP, maintenance records, and other operational sources into a more connected analytics environment.
Consistent Operational KPIs
Standardize calculation rules, reporting periods, and data definitions so reliability, load, asset performance, and other operational KPIs stay comparable across teams.
Practical Spotfire Expertise
Cadeon combines energy data analytics consulting with deep Spotfire experience to build dashboards with useful filters, drilldowns, exception views, and access to supporting operational records.
Access and Reporting Controls
Set up user access, data handling rules, and traceable calculations so teams can work from reliable information while maintaining appropriate control over operational reporting.
Keep Your Utility Analytics Reliable After Launch
Analytics environments do not stay static. New data sources get added, reporting needs change, and dashboards need to evolve with the way your teams work. Cadeon provides ongoing support to keep your utility analytics environment accurate, connected, and useful after implementation.
Data Pipeline Monitoring
Keep data moving reliably between SCADA, GIS, ERP, metering, maintenance, and analytics systems. We help identify failed refreshes, broken connections, and data quality issues before they affect reporting.
Practical Spotfire Expertise
Cadeon combines energy data analytics consulting with deep Spotfire experience to build dashboards with useful filters, drilldowns, exception views, and access to supporting operational records.
Ongoing Analytics Support
Get direct access to experienced analytics and Spotfire specialists for troubleshooting, dashboard improvements, new reporting requirements, and environment expansion.

Disconnected Systems and Conflicting KPIs
SCADA, AMI, GIS, ERP, CMMS, and metering platforms can describe the same asset differently. That leads to mismatched records, conflicting KPI values, and extra work during analysis. Cadeon helps align identifiers, calculations, and reporting definitions so operations, maintenance, and leadership teams can work from a more consistent view.
Slow Analytics and Manual Reporting Loops
Recurring exports, spreadsheet calculations, and manual data checks make even routine reporting harder than it needs to be. We connect and automate the underlying data flow so dashboards refresh more consistently and teams can spend less time preparing reports and more time investigating what the numbers mean.
Turn Utility Data Into Decisions Your Team Can Use
Work with Cadeon to connect operational systems, strengthen data pipelines, and build analytics that give utility and energy teams a clearer view of performance. From utilities data analytics and Spotfire dashboards to data integration and ongoing consulting, we can help improve the analytics environment you already have.

Frequently Asked Questions
What is utilities data analytics?
Utilities data analytics brings operational, asset, maintenance, and business data together so teams can monitor performance, investigate issues, and improve reporting. This can include data from SCADA, AMI, GIS, ERP, CMMS, metering platforms, databases, and other operational systems. Cadeon helps connect these sources into a more consistent analytics environment so utility teams can work with clearer, more reliable information.
What does data analytics consulting for utilities include?
Cadeon’s data analytics consulting for utilities can include data integration, pipeline development, KPI standardization, dashboard development, reporting automation, and ongoing analytics support. The work can focus on improving an existing analytics environment or building the missing connections between operational systems, data, and reporting tools.
Can Cadeon connect SCADA, AMI, GIS, ERP, and maintenance data?
Yes. Cadeon builds data pipelines and integrations that connect information from SCADA, AMI, GIS, ERP, CMMS, metering, maintenance systems, databases, and other operational sources. We also help align asset identifiers, reporting fields, and KPI definitions so information from different systems can be compared more consistently.
How is Spotfire used for energy and utilities data analytics?
Spotfire can bring operational and maintenance data into interactive dashboards where teams can monitor KPIs, compare assets, investigate outages or performance changes, and drill from summary metrics into supporting records. Cadeon provides Spotfire consulting, dashboard development, integration, optimization, and ongoing support for energy and utilities organizations.
Does Cadeon provide oil and gas data analytics consulting?
Yes. Cadeon has experience supporting upstream oil and gas and drilling operations alongside utility organizations. Oil and gas data analytics can bring production, equipment, maintenance, drilling, and other operational records together to support performance analysis, reporting, and investigation of operational issues.
Can Cadeon improve an existing utility analytics environment?
Yes. A complete rebuild is not always necessary. Cadeon can improve existing data pipelines, Spotfire deployments, dashboards, calculations, KPI definitions, reporting workflows, and integrations. This allows teams to expand their utilities data analytics capabilities while continuing to use systems and processes that are already working.