
Banking and Insurance Analytics That Makes Risk and Reporting Clear
Cadeon helps banks and insurers connect data across teams so reporting is faster and decisions are backed by facts. Get stronger visibility for risk, customer trends, operations, and compliance without messy manual work.


Risk and Compliance Reporting
Build consistent reporting for audits, regulatory needs, and internal controls with traceable KPI logic.
Customer and Portfolio Analytics
Track customer trends, product performance, and portfolio movement using unified data across platforms.

Fraud and Anomaly Monitoring
Spot unusual patterns earlier using rule-based signals and trend monitoring tied to real transaction context.
Operational Performance Dashboards
Monitor turnaround time, claims or case flow, service performance, and cost metrics in one view.

Numbers That Improve When Reporting Gets Consistent
Less manual data gathering and fewer last-minute fixes before submission deadlines.

Standard KPI definitions reduce mismatched numbers across teams and tools.
Trend monitoring surfaces anomalies earlier for faster review and action.

Built for regulated reporting
Reporting logic is documented and consistent, so teams can explain numbers without scrambling.
Strong cross-system integration
Core platforms, CRM, finance tools, and warehouses get connected so data stops living in silos.
Analytics that fits real workflows
Dashboards are structured for monitoring, reviews, and reporting cycles, not just visuals.
Support that stays involved
Ongoing help for KPI changes, new views, and system updates as requirements shift.
Staying Accurate After Go-Live
Banking and insurance data changes constantly. We keep your reporting clean so teams don’t lose time fixing issues.
Data monitoring
Quick checks on loads and refresh cycles to catch gaps early.
Analytics that fits real workflows
Dashboards are structured for monitoring, reviews, and reporting cycles, not just visuals.
Add new views fast
Launch a new dashboard or segment without rebuilding the full setup.


Different Systems, Different Numbers
We align KPIs and build one reporting layer so the same metric shows the same value everywhere.
Slow Reporting Cycles and Manual Reconciliation
We automate refresh cycles and standardize logic so reporting becomes routine, not a monthly emergency.
Ready for Reporting Your Teams Can Trust?
Let’s connect your systems, standardize your KPIs, and build dashboards that support risk, compliance, and performance without the manual grind.

Frequently Asked Questions
What is banking analytics?
Banking analytics is the process of connecting, organizing, and analyzing banking data to improve reporting, risk monitoring, customer insights, compliance, and operational performance. Cadeon helps banks turn disconnected data into trusted dashboards and consistent KPIs for faster decision-making.
What is insurance analytics?
Insurance analytics helps insurers use claims, policy, customer, financial, and operational data to improve reporting, identify trends, monitor risk, and make better business decisions. Cadeon supports insurance analytics by connecting systems, standardizing metrics, and building dashboards teams can trust.
How does Cadeon help banking and insurance teams improve reporting?
Cadeon helps banking and insurance teams improve reporting by connecting data across core systems, CRM, claims platforms, policy systems, finance tools, spreadsheets, and data warehouses. This creates one trusted reporting layer with consistent KPI logic and fewer manual reporting steps.
Can Cadeon support risk and compliance reporting?
Yes. Cadeon supports risk and compliance reporting by building traceable, consistent reporting workflows for audits, regulatory needs, internal controls, and leadership reviews. The goal is to make reports easier to explain, easier to validate, and more reliable across teams.
How can banking analytics improve risk monitoring?
Banking analytics improves risk monitoring by bringing key data into dashboards that help teams spot unusual patterns, track portfolio movement, monitor operational trends, and respond earlier to potential issues. This reduces reliance on manual checks and disconnected reports.
How can insurance analytics help claims and operations teams?
Insurance analytics can help claims and operations teams monitor turnaround times, claims flow, service performance, cost metrics, customer trends, and anomaly signals. Cadeon builds dashboards that make this information easier to track and act on.
Can Cadeon help reduce manual reporting in financial services?
Yes. Cadeon helps reduce manual reporting by automating refresh cycles, standardizing KPI definitions, connecting systems, and replacing spreadsheet-heavy workflows with reliable dashboards. This helps teams spend less time reconciling numbers and more time reviewing insights.
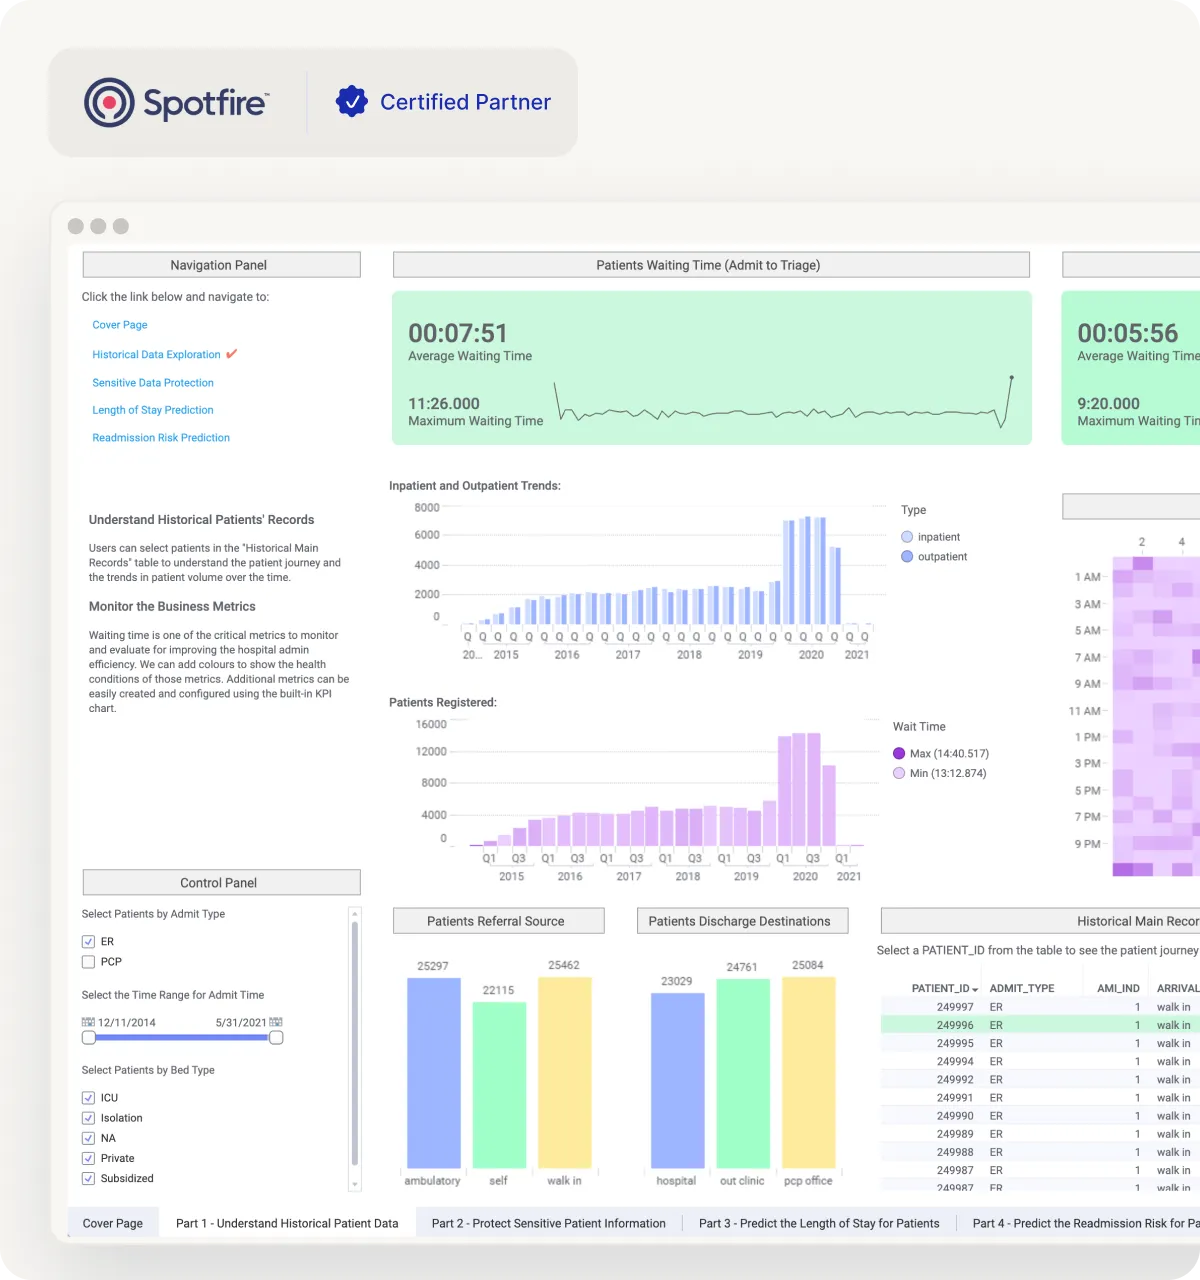
Does Cadeon build Spotfire dashboards for banking and insurance analytics?
Yes. Cadeon builds Spotfire dashboards for banking analytics and insurance analytics, including dashboards for risk, compliance, operations, customer trends, portfolio performance, claims monitoring, and leadership reporting. These dashboards are structured around real workflows, reporting cycles, and decision-making needs.