
Life Sciences Data Analytics for Quality and Operational Performance
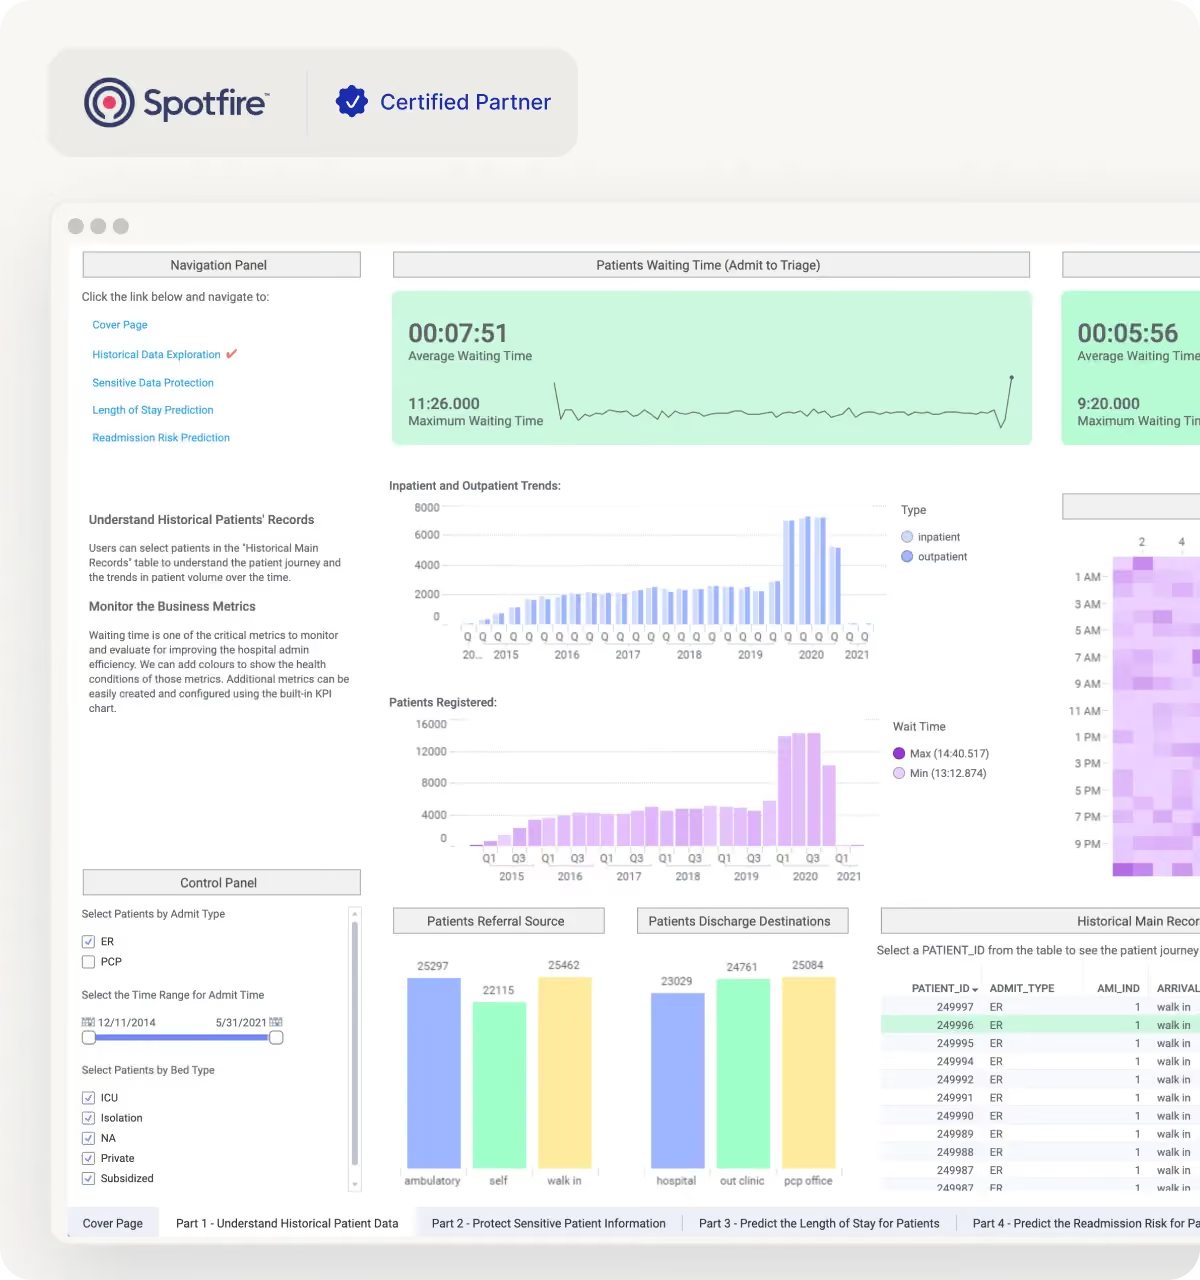
Cadeon provides life sciences analytics consulting to help quality and operations teams turn lab, batch, and manufacturing data into clear reporting. Connect your systems, track performance, and investigate recurring issues with Spotfire dashboards that support daily reviews.


Quality and Deviation Analytics
Review deviations, corrective and preventive actions (CAPA), and out-of-specification (OOS) results alongside batch data. Identify recurring patterns and narrow down where investigation is needed.
Batch and Process Performance
Compare batch cycle times, yields, and process exceptions using connected lab and manufacturing records. Spot changes that need attention during quality and operational reviews.

Compliance-Friendly Reporting
Use consistent calculations and traceable source data to support audit preparation. Help reviewers understand how reported figures were produced and investigate discrepancies.
Supply and Inventory Visibility
Connect inventory levels, material needs, and production plans in one view. Help teams identify potential shortages, review stock availability, and coordinate supply decisions before they affect batch schedules.
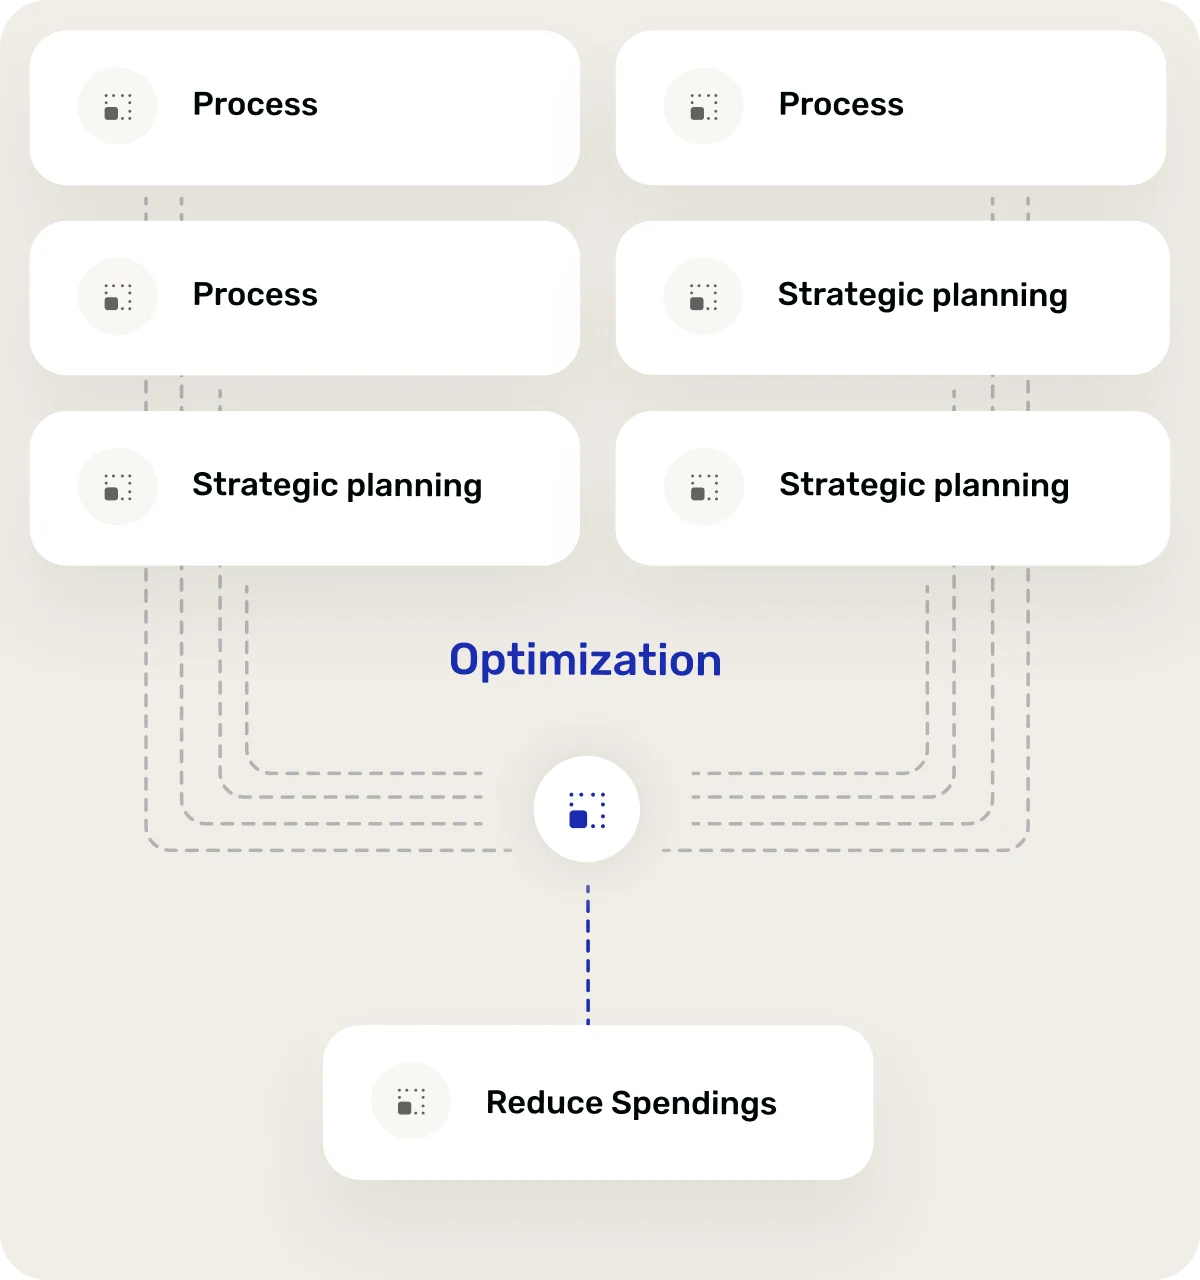

Measure Progress Across Quality and Reporting
Measure the time spent collecting and checking data for batch, deviation, and quality reports.

Track how often teams need to resolve conflicting figures across lab, quality, and production systems.
Review how quickly teams can connect a quality issue with the relevant batch and process records.
Built for Regulated Workflows
Keep metric definitions and reporting logic traceable so reviewers can understand how figures were produced and investigate differences across reports.
Strong System Connectivity
Bring lab, quality, manufacturing, and planning records together so teams can review related information without collecting separate exports from each system.
Dashboards Teams Actually Use
Organize views around batch reviews, quality checks, and operational meetings, with filters that help each team find the information it needs.
Support That Stays Involved
Adapt KPI definitions, dashboard views, and data connections as products, processes, and reporting requirements change, with ongoing support agreed for your team.
Keep Life Sciences Reporting Accurate After Launch
New products, process changes, and system updates can affect your reports. Cadeon’s managed services help maintain data connections, review dashboard issues, and adapt reporting as your requirements change.
Data Refresh Monitoring
Review agreed data flows and investigate missing records or delayed updates that affect batch, quality, and operational reports.
Dashboards Teams Actually Use
Organize views around batch reviews, quality checks, and operational meetings, with filters that help each team find the information it needs.
Dashboard Changes and Additions
Extend existing views for new products, quality indicators, or review requirements so reporting continues to support your team’s daily work.

Quality Signals Arrive Late or Out of Context
Deviations, OOS results, and CAPA data often sit separate from batch and production context. We connect the sources so teams can review trends with the “why” and “where” attached, not just the final number.
Too Many Versions of the Same KPI
Yield, cycle time, release timing, and quality counts can vary across reports. We standardize KPI logic and build one reporting layer so teams stop reconciling spreadsheets and start acting on the data.
Ready for Analytics That Holds Up Under Review?
Discuss your lab, quality, and batch reporting challenges with Cadeon. Our life sciences data analytics services help you connect the relevant records, clarify KPIs, and develop dashboards that support your review process.

Frequently Asked Questions
What is life sciences data analytics?
Life sciences data analytics brings together data from lab, quality, manufacturing, and other business systems to help teams understand performance. Cadeon focuses on reporting that supports batch reviews, quality investigations, and operational decisions through connected records and consistent KPIs.
How does Cadeon help life sciences and pharma teams improve reporting?
Cadeon connects sources such as LIMS, QMS, ERP, and manufacturing systems, aligns KPI definitions, and builds dashboards for quality and operational reviews. Our pharmaceutical data analytics work helps teams compare batch results, investigate deviations, and reduce the manual effort needed to prepare reports.
Can Cadeon support compliance-friendly reporting?
Yes. Cadeon supports compliance-friendly reporting by creating consistent, traceable reporting logic across key metrics. This helps teams reduce manual reconciliation, prepare for audits more efficiently, and explain performance data with greater confidence.
What systems can Cadeon connect for pharma analytics?
Cadeon can help connect data from LIMS, QMS, ERP, MES, manufacturing systems, planning tools, trial systems, and spreadsheets. By bringing these sources together, teams can reduce data silos and create one clearer reporting layer for quality, operations, and leadership.
How can pharma analytics improve quality and deviation tracking?
Pharma analytics can improve quality tracking by connecting deviation, CAPA, OOS, batch, and production data in one view. This helps teams identify recurring issues, understand root causes faster, and monitor quality signals with better context.
Does Cadeon build Spotfire dashboards for life sciences analytics?
Yes. Cadeon builds Spotfire dashboards for life sciences analytics, including dashboards for batch performance, deviation tracking, CAPA trends, quality metrics, manufacturing performance, supply visibility, and leadership reporting. These dashboards are designed around real review cycles and regulated workflows.
Which life sciences performance analytics can Cadeon support?
Cadeon helps teams monitor batch cycle time, yield, deviations, corrective and preventive actions (CAPA), out-of-specification (OOS) results, and inventory availability. The measures depend on your processes and available data. We align their definitions so teams can compare performance across reports and review periods.
What does a life sciences analytics consulting project involve?
We begin with your reporting priorities, source systems, and the questions your reviewers need to answer. Cadeon then defines the data connections, KPI rules, and dashboard requirements with your team. A focused first project can address a recurring quality report, batch performance view, or manual reconciliation problem.