3 Ways Data Visualization Makes Your Marketing Presentation More Impactful
Do you have an upcoming marketing meeting? Here are 3 reasons to use data visualization for your next marketing presentation.
Data visualization tools offer executives and business owners an innovative approach to dramatically improve their ability to grasp information hiding in their data. Some of the greatest advantages offered by data visualization to organizations include:
- Enhanced assimilation of business information
- Better access to important and relevant business insights
- Identification of key business trends
- Easy comprehension of data
- Enhanced action and decision making
Grow Your Calgary Business With Our Data Visualization Services
With years of experience and a wide range of tools at our disposal, Cadeon is well positioned to meet all of your data visualization needs. In addition to extensive training, our team uses a whole range of technologies to help you see ‘the whole picture’.
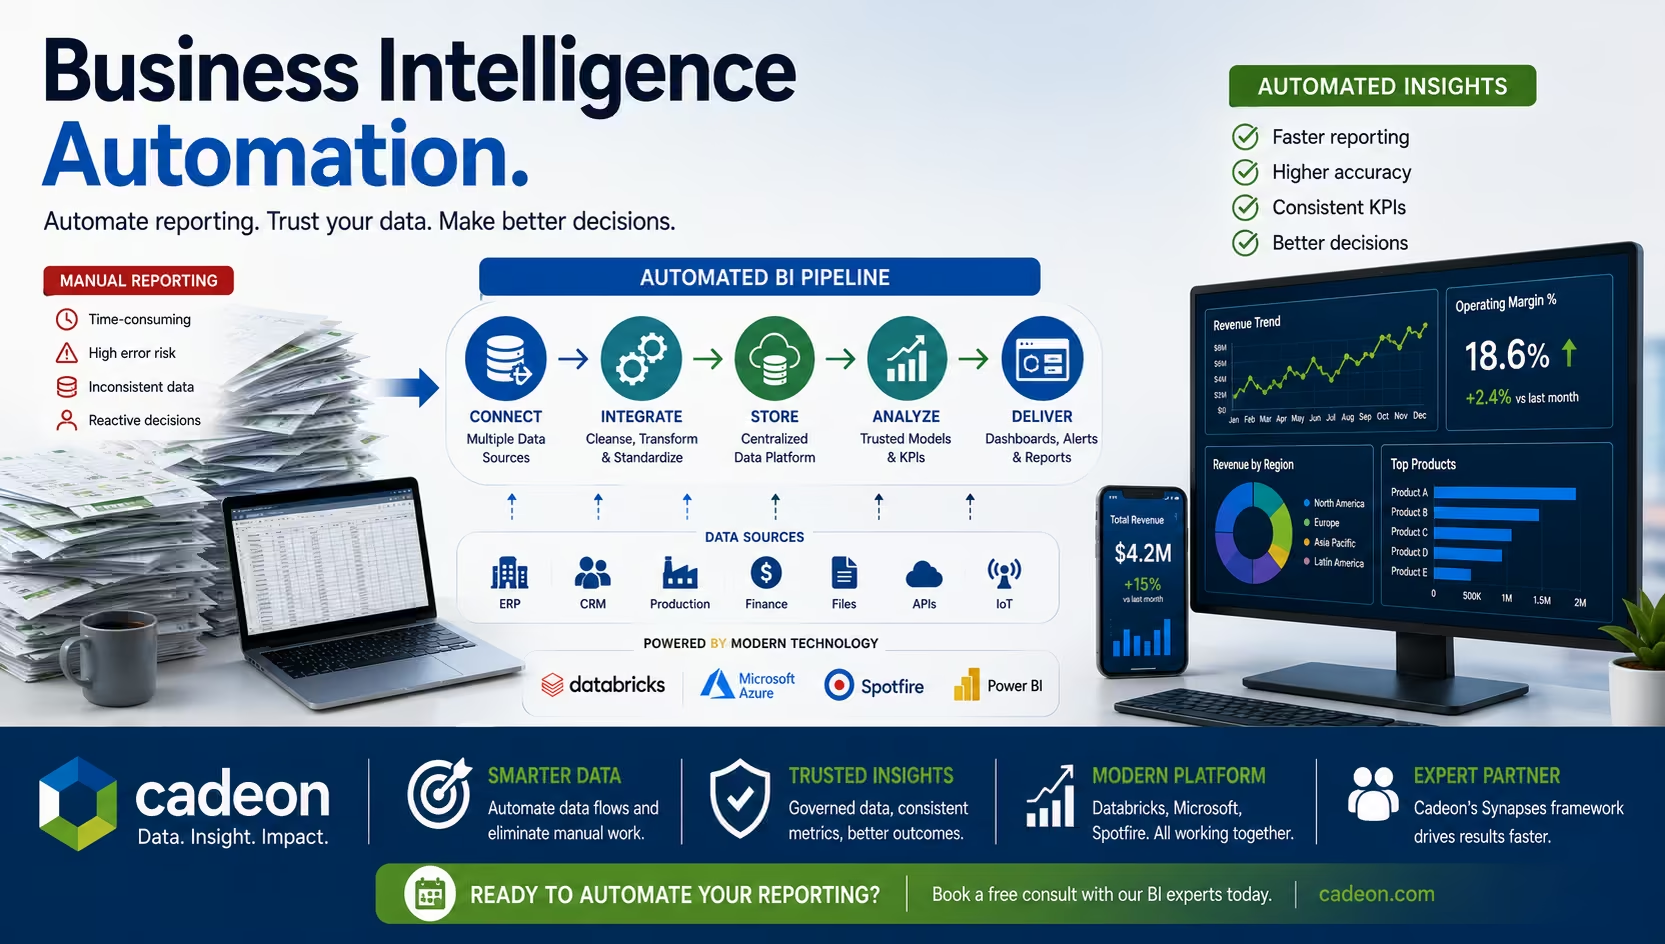
3 Reasons to Use Data Visualization at Your Next Marketing Meeting
Data visualization is a way of showcasing data through images and charts. This not only makes it easier to see meaningful patterns, but it also makes it easier to draw conclusions and make more informed business decisions.
Data visualization is especially helpful when presenting data to others. Because people understand data much more easily when it’s presented visually, this makes it easier to get your point across, or persuade someone.
Here are 3 reasons you need to use data visualization for your next marketing meeting:
1. It Adds Credibility to Your Presentation
When done correctly, data visualization can help you effectively communicate insights to your team, boss, or company in any marketing meetings. In addition, it will allow you to:
- Uncover patterns, correlations and outliers.
- Demonstrate that your marketing team is making data-backed decisions.
- Showcase that you’re holding your team accountable and ensuring that every member is executing their initiatives with excellence.
PRO TIP: You always want to hold true to your data. If you misrepresent it, or present it ineffectively, it will hurt both your message and your presentation.
2. It Encourages Audience Engagement
It’s much easier for people to understand data when it is presented visually, which is why data visualization makes it easier for you to make your point, or persuade someone, be it stakeholders or clients.
Clean, compelling, and credibly sourced visuals will draw your audience into the content and allow them to examine the data and derive a deeper meaning from it. This will create a more personal and significant interaction that will greatly improve your presentation.
3. It Increases Impact
Numbers and statistics alone won’t necessarily make the desired impact if your audience can't interpret and comprehend them. That’s why data visualization is key. When supported by a robust data pipeline integration, it allows individuals to really see the data and what it means, increasing their retention and comprehension while ensuring your presentation makes a lasting impression.
Call Today
Your data is only as good as your ability to understand and communicate it. To find out more about how our data visualization services can help you stand out from your competition and really make a lasting impression on your audience, contact us today at (403) 475-2494 or fill out our online contact form. You can find our offices at 800 5 Ave SW Suite 520, Calgary, AB T2P 3T6.
No items found.
Ready to transform your data strategy?
You might also like
.png)
AI As a Paradigm Shift
Here’s something our team has been talking about. If your organization is investing in AI—pilots, platforms, use cases—but somehow the results still feel incremental instead of transformative, then keep reading.
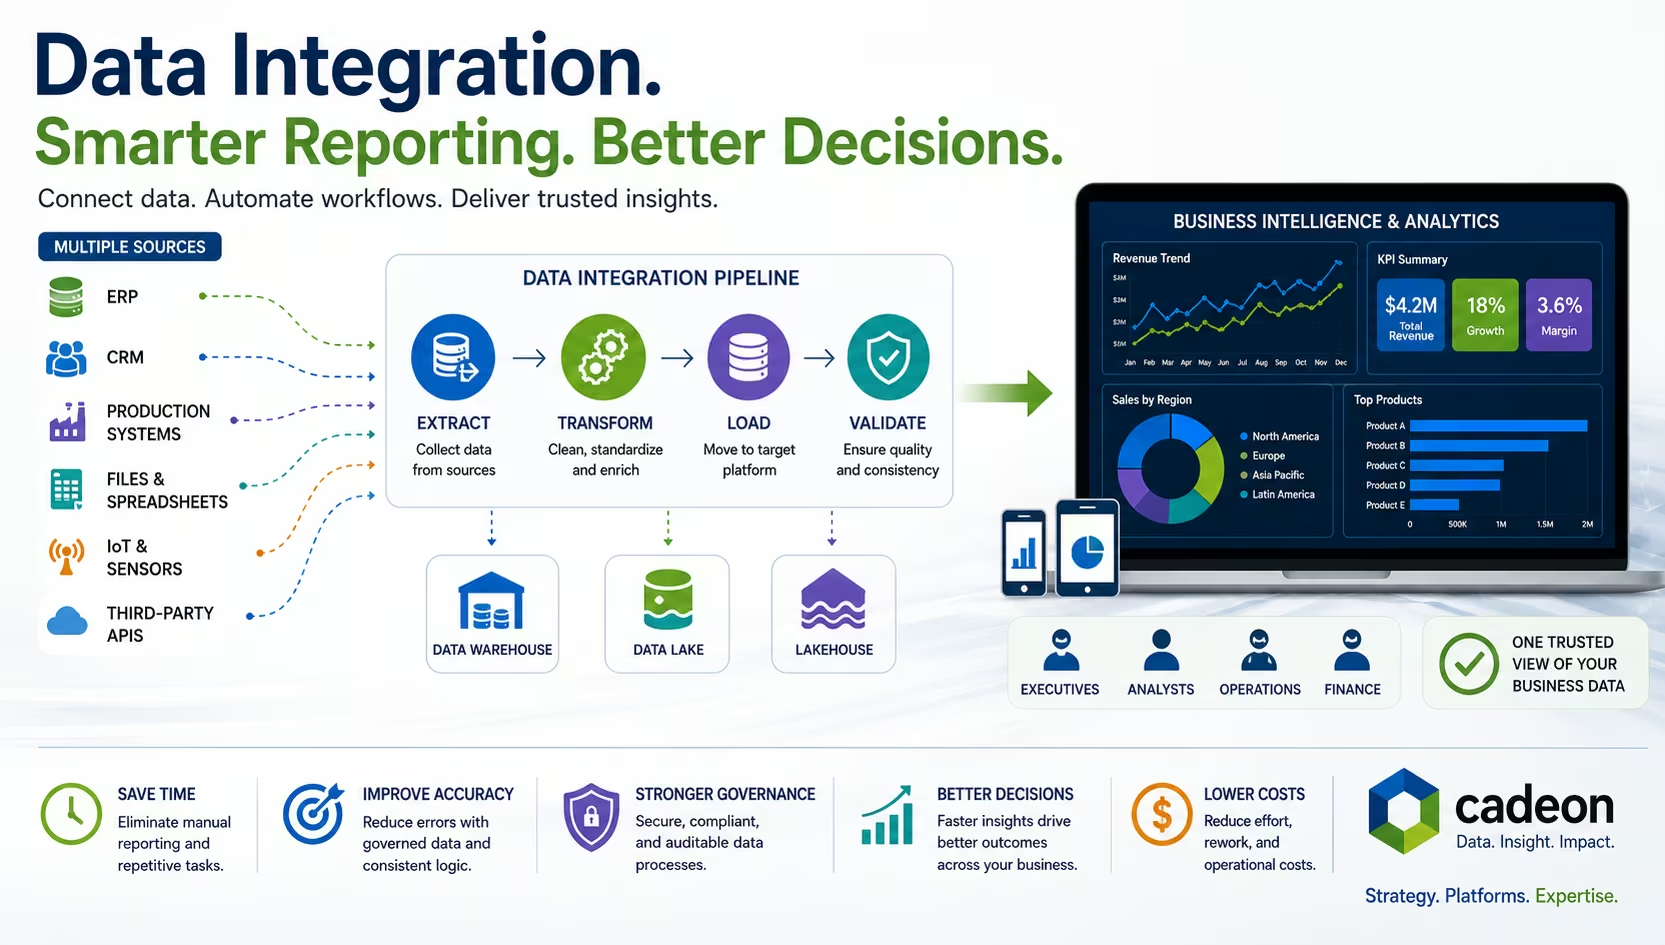
What Is Data Integration? Methods, Tools, and BI Explained