Spotfire Data Governance Framework Ops Will Use: Fix KPI Trust
If your plant manager has to pick between a control-room gauge and the dashboard, they’ll pick the gauge every time. Most asset-intensive operations teams have been burned by bad numbers: downtime KPIs that don’t match field reality, production losses that get “fixed” at month-end, and financial reports that never quite tie to the historian.
Underneath those mismatched numbers is usually the same root cause: no shared, trusted data governance framework across systems like SCADA, historians, EAM, and finance – and no clear link from those rules into the Spotfire dashboards people stare at every day.
The good news? You don’t need a 200‑page policy binder to fix KPI trust. You need a practical, operations-first approach that lines up people, process, and Spotfire in a way your field, maintenance, and reliability leaders will actually stick with.

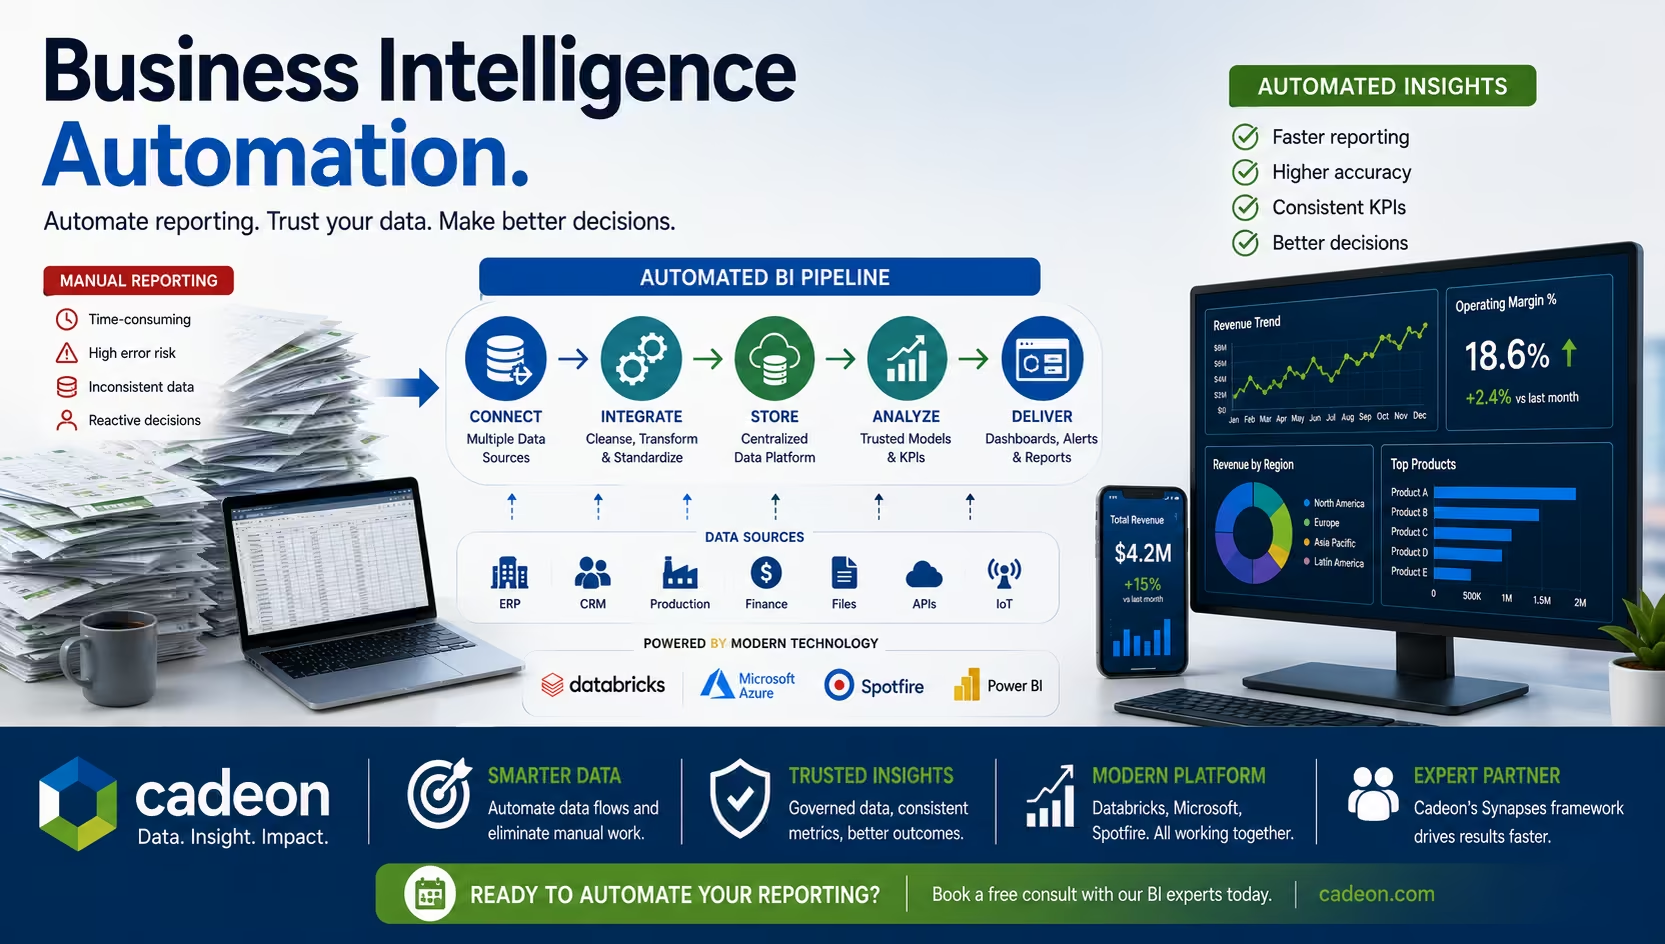
Aligning real-time control room data with governed Spotfire dashboards is the foundation of KPI trust.
TL;DR
Short on time? Here’s the essence:
- Start with a few make-or-break operational decisions, not every data set in your company.
- Assign real data owners and stewards from operations, then back them with IT custodians.
- Create a lightweight KPI and data catalog, and surface it directly inside Spotfire.
- Standardize governed data views and Spotfire semantics so every dashboard tells the same story.
- Lock it in with simple governance “rituals” (reviews, playbooks, change control) that respect field reality.
Why operations don’t trust KPIs (yet)
In energy, utilities, manufacturing, and other asset-heavy industries, your teams juggle SCADA, historians, EAM/CMMS, production accounting, and finance. When the numbers on the Spotfire dashboard don’t match what the supervisor sees on the panel or in SAP PM, trust evaporates fast.
Common symptoms we see when we work with Spotfire consulting and training clients across North America:
- Multiple versions of the truth: “Daily production” means one thing to operations, another to finance, and a third to corporate reporting.
- Hidden logic: Business rules live inside ad hoc SQL, Spotfire expressions, or a dusty Excel macro nobody wants to touch.
- No root-cause path: When a KPI looks wrong, nobody can trace it back through systems quickly enough to fix it before the next meeting.
If people spend meetings arguing about the number instead of the decision, your data governance isn’t doing its job.
Studies of analytics‑driven organizations show that companies that integrate analytics into day‑to‑day operations are several times more likely to substantially outperform their peers. But that only happens when front-line teams actually trust the numbers in front of them.
What a modern governance framework looks like in Spotfire
Standard models such as DAMA‑DMBOK describe data governance as the coordinating function that sits at the centre of disciplines like data quality, metadata, architecture, and security (DAMA‑DMBOK data governance overview). In plain language: it’s how you decide what data means, who owns it, how it’s changed, and how issues get fixed.

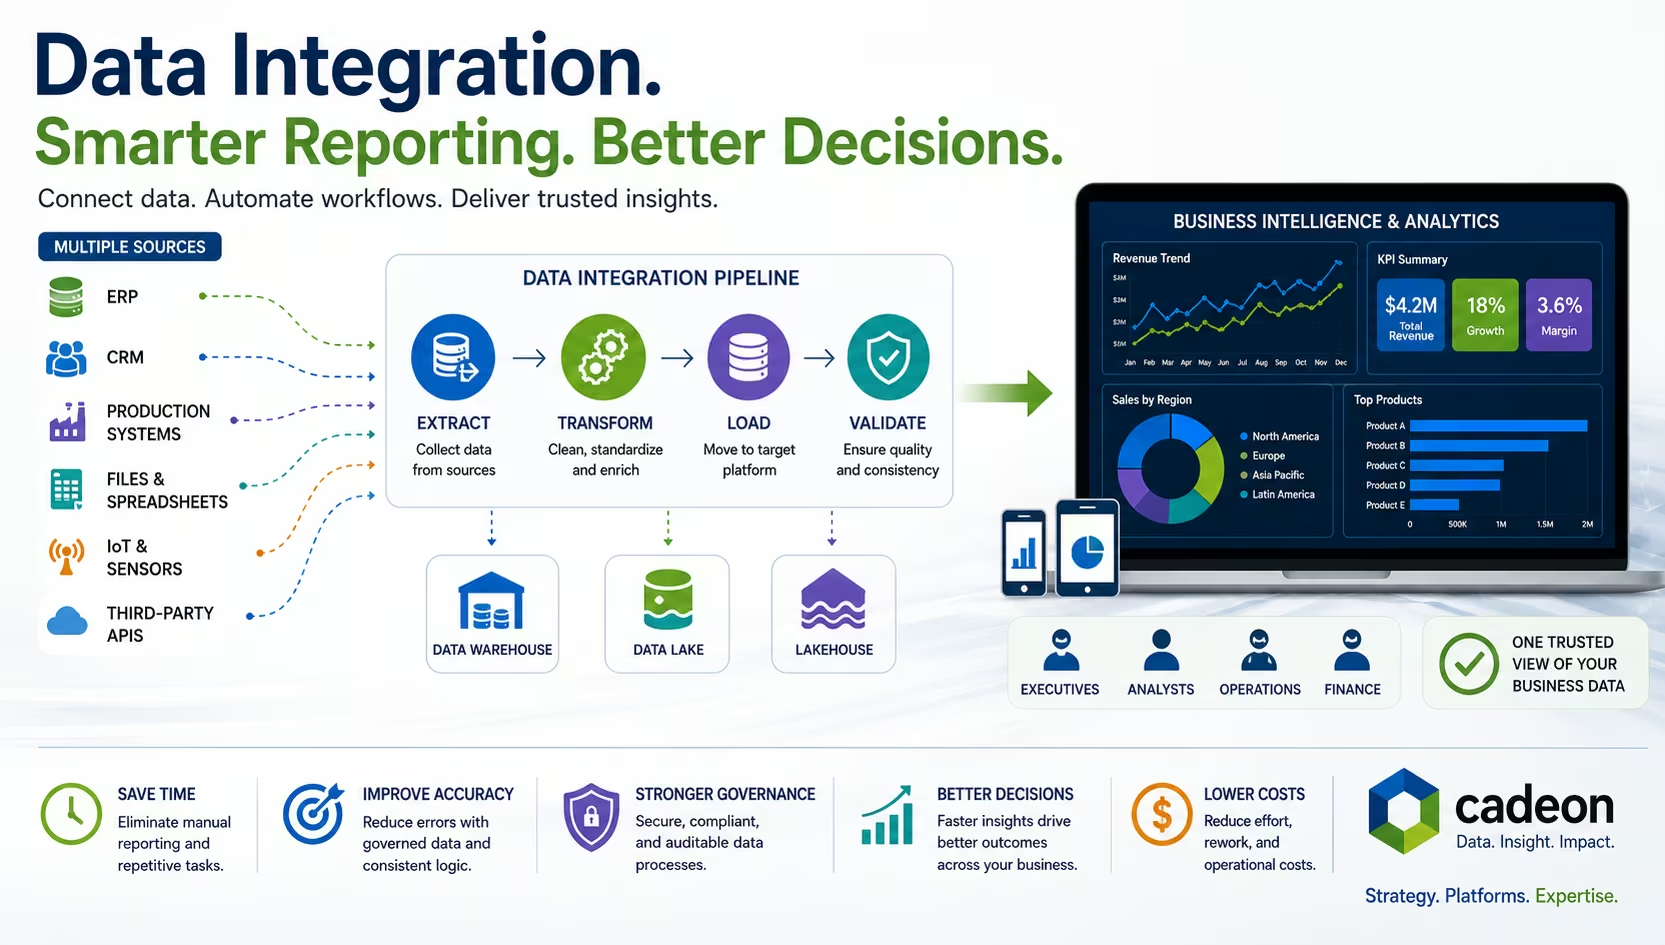
A clear data governance framework links definitions, ownership, and KPIs before they ever reach Spotfire.
In a Spotfire world, that governance needs to be tightly linked to how dashboards are built and consumed. A practical setup for asset‑intensive enterprises usually includes:
- Roles: Clear data owners, stewards, and custodians tied to operational domains (e.g., production, maintenance, reliability).
- Standards: Agreed KPI definitions, grains, filters, and data-retention rules.
- Technical patterns: Curated, governed views or virtualized layers feeding Spotfire – not one-off queries against raw sources.
- Processes: Lightweight review, sign‑off, and change control so updates don’t blindside the field.
Analytics platforms like Spotfire already include strong governance hooks – from data lineage and semantic layers to built‑in security and central deployment (Spotfire governance capabilities). The framework we’re talking about is how you design the human and process side to take advantage of those capabilities.
A five-part data governance framework that operations will actually use
Here’s the pattern we’ve seen work again and again for clients who want trusted KPIs in Spotfire without burying operations in bureaucracy.
1. Start with critical operational decisions, not every dataset
Don’t begin with a giant data catalog; begin with the decisions that move the needle. For asset‑intensive enterprises, that’s usually questions like:
- Which assets are most at risk of unplanned downtime in the next 24–72 hours?
- Where are we losing the most production to avoidable losses this month?
- Which work orders should maintenance crews tackle first to protect throughput and safety?
Pick three to five such decisions and trace each KPI back to source systems, business rules, and owners. That narrow focus keeps the governance effort anchored in real value instead of turning into a theoretical exercise.
2. Assign clear data ownership, stewardship, and custodianship
Most governance failures are people failures: everybody assumes someone else is watching the data. Industry guidance draws a clear line between three core roles (data governance roles and responsibilities).
Document these roles on one page per domain. When a KPI looks wrong, your teams should instantly know who owns the decision, who owns the definition, and who owns the plumbing.

Cross-functional ownership turns data governance from a policy document into a working Spotfire practice.
3. Build a lightweight KPI & data catalog linked to Spotfire
You don’t need an enterprise data catalog tool to get started. For your priority KPIs, create a simple catalog (even a governed table in SQL Server or TDV) with columns like:
- KPI name and business description
- Formula and aggregation grain (per well, per facility, per day, etc.)
- Inclusions/exclusions and standard filters (e.g., shut‑in reasons to exclude)
- Source systems and tables/views
- Data owner and steward
- Expected refresh frequency and latency
Then connect this catalog to Spotfire:
- Expose definitions via hover‑over tooltips or an “Info” panel in key dashboards.
- Allow users to click from a KPI to see its underlying data set and source system.
- Use calculated values in Spotfire to pull descriptions and owners from the catalog, so documentation stays in sync automatically.
4. Standardize trusted data pipelines and semantic layers
This is where Spotfire and your data architecture meet. The goal: every dashboard that shows, say, “Net Production Volume” should hit the same governed logic, regardless of who built it.
Practical steps:
- Create curated database views or virtualized layers (e.g., through data virtualization) that implement your KPI rules once.
- Use Spotfire’s data table layer and data functions consistently, so complex logic lives in reusable components instead of single analyses.
- Define row‑level security and subject-area–based access on the governed layer, not on each dashboard.
- Establish a promotion path (Dev → Test → Prod) for Spotfire analyses that depend on these governed views.
If you don’t have the internal bandwidth to design this data layer, our consulting and implementation team can bring patterns from real Spotfire projects across energy, utilities, and manufacturing.
5. Close the loop with governance rituals operations respect
Finally, you need lightweight routines that keep the framework alive without bogging people down. For asset‑intensive operations, we’ve seen the following work well:
- Monthly KPI huddle: 30–45 minutes with owners, stewards, and key supervisors to review exceptions, proposed rule changes, and open issues.
- Change playbooks: For each critical KPI, a one‑pager that explains what happens when the definition changes and who must be informed.
- Spotfire release gates: No dashboard that changes a governed KPI can hit production without sign‑off from the data owner and steward.
- Issue log: A simple log or ticket queue for “this KPI doesn’t look right,” with SLA and clear assignment.
These practices sound simple, but they move conversations from “Can we trust this?” to “What do we do about it?” – which is where operations teams want to live.
Make governance visible inside Spotfire
Even the best framework fails if users can’t see it in their daily tools. Your Spotfire environment should make governance obvious and convenient for supervisors, engineers, and managers.
Ideas we regularly implement for clients:
- Info tab on every governed dashboard: KPI list, definitions, last refresh time, data owner, and steward.
- Contextual tooltips: Hover over a KPI to see its formula, grain, and filters pulled directly from the catalog.
- Visual cues for governed content: Naming conventions or icons in the Spotfire library (for example, prefixing governed analyses with “[GOV]”).
- Usage monitoring: Using Spotfire action logs to see which governed analyses drive the most value – and where confusion still exists. (We cover this in more depth across several posts on the Cadeon blog.)
When operators can answer “What does this KPI mean, and where does it come from?” without leaving Spotfire, trust follows naturally.
A 90-day roadmap to get started
If this all sounds like a lot, break it into a 90‑day plan. Here’s a simple way to structure the work.

A focused 90-day roadmap makes your data governance framework for Spotfire achievable instead of overwhelming.
Days 0–30: Discover and prioritize
- Identify three to five high‑value operational decisions and their supporting KPIs.
- Run quick interviews with supervisors and analysts to surface pain points and “data myths.”
- Nominate data owners and stewards for each domain.
- Inventory key Spotfire analyses, data sources, and current calculation logic.
Days 31–60: Design and build the backbone
- Draft your one‑page governance standard (roles, principles, promotion path).
- Stand up the initial KPI and data catalog for your priority metrics.
- Build curated or virtualized data views that implement agreed business rules.
- Refactor one or two critical Spotfire dashboards to use the governed layer.
Days 61–90: Pilot, prove, and extend
- Roll the new governed dashboards out to a selected asset, plant, or region.
- Run side‑by‑side checks against legacy reports to prove consistency.
- Hold monthly KPI huddles and refine rules based on field feedback.
- Document wins (fewer reconciliations, faster decisions, less rework) to build momentum.
Where Cadeon fits in
Cadeon has spent more than 15 years helping asset‑intensive organizations turn disconnected operational data into trusted, decision‑ready insight – with Spotfire at the heart of the solution.
As a long‑time Spotfire partner, we help clients:
- Design pragmatic data governance and KPI frameworks anchored in real operations.
- Implement governed data layers using Spotfire, data virtualization, and modern data platforms.
- Train engineers, analysts, and supervisors through hands‑on Spotfire consulting and training so the framework sticks.
- Support production environments through our Spotfire support desk when issues crop up at 6 a.m.
If you’d like to see how this could work for your team, you can explore our proven, time‑boxed transformation engagements on the main site or talk directly with our experts about your situation.
Bringing it all together
At the end of the day, your operators don’t care about governance jargon. They care that when they open a Spotfire dashboard, the KPIs line up with what they see in the field – every time.
Start small, keep the rules close to the work, and make the framework visible inside Spotfire. Do that, and you’ll feel the shift from “we don’t trust the numbers” to “we can finally run the business off this screen.”
About the Cadeon Data & Analytics Team
The Cadeon Data & Analytics Team brings decades of combined experience in enterprise architecture, Spotfire consulting, and information management across energy, utilities, manufacturing, transportation, and more.
From designing loss‑management solutions for oil and gas operators to modernizing reporting for real estate and sports organizations, our consultants focus on one thing: turning information into money through clear, trusted analytics your teams actually use.
No items found.
Ready to transform your data strategy?
You might also like
.avif)
AI As a Paradigm Shift
Here’s something our team has been talking about. If your organization is investing in AI—pilots, platforms, use cases—but somehow the results still feel incremental instead of transformative, then keep reading.
What Is Data Integration? Methods, Tools, and BI Explained