From Static to Dynamic The Future of Data Visualization

Data visualization has undergone a remarkable evolution over the past few decades. From static bar charts and pie graphs to dynamic, interactive dashboards, data visualizations have transformed the way we present and interpret information. This shift reflects the growing demand for more insightful, real-time, and customizable data interpretation.One of the most significant advantages of interactive visualizations is their ability to support root cause analysis. By allowing users to drill down into specific data points, filter information dynamically, and identify patterns in real time, these tools provide deeper insights into complex issues and challenges. This capability is crucial for businesses and decision-makers looking to diagnose problems efficiently and implement data-driven solutions.The future promises even more innovation, as technology drives new possibilities for dynamic and immersive visualizations. With advancements in artificial intelligence, augmented reality, and real-time analytics, data visualization is set to become an even more powerful tool for uncovering insights and driving informed decision-making.
The Limitations of Static Visualization
Static visualizations served as a foundation for data analysis. These charts and graphs simplified complex datasets into easy-to-understand visuals. However, they come with significant limitations. They often lack the ability to represent real-time data or allow interaction. Static charts provide a snapshot, but they fail to evolve as new information becomes available.To fully grasp the potential of evolving technologies, businesses must first understand what is data visualization and how it impacts decision-making. With a clearer understanding, organizations can move beyond outdated methods and embrace tools that adapt to changing conditions.
Why Dynamic Visualization is Essential
Dynamic visualizations address the limitations of static representations. They offer real-time updates, interactivity, and customization. Users can explore datasets by zooming in, filtering results, or drilling down into specifics. These features empower businesses to identify patterns, uncover insights, and respond quickly to emerging trends.Interactive dashboards are a key example of dynamic visualization. They consolidate multiple data sources into a single, cohesive view. Visual Data Scientists play a critical role in designing these tools, leveraging advanced algorithms to create user-friendly interfaces and actionable insights.
Emerging Trends in Data Visualization
The future of data visualization is being shaped by cutting-edge technologies and innovative practices. Some of the most exciting trends include:
- AI-Powered VisualizationsArtificial intelligence enables automated pattern recognition and predictive analytics. AI can highlight trends that might go unnoticed in traditional visualizations, providing actionable insights.
- Augmented Reality (AR) DashboardsAR takes visualization into the physical space. Users can project dashboards onto their surroundings, creating an immersive experience for data analysis and collaboration.
- Real-Time Streaming VisualsWith the rise of IoT devices and live data feeds, real-time visualizations have become essential. Businesses can monitor processes, detect anomalies, and respond instantly.
- Storytelling with DataVisual narratives combine data and storytelling to engage audiences. A compelling data visualization example might include animated charts that highlight trends over time or illustrate complex concepts clearly.
The Role of Customization and Personalization
Every organization has unique goals and challenges. Visualization tools that cater to these needs are crucial for effective decision-making. Customization allows users to tailor dashboards to specific objectives, ensuring relevance and clarity.Personalized visualizations go a step further. By analyzing user behavior, these tools can present the most pertinent information automatically. For instance, a marketing manager might see campaign performance metrics, while a CFO focuses on financial trends. This personalized approach often results in good data visualization, ensuring that insights are not only accurate but also easy to interpret.
How Businesses Benefit from Dynamic Visualization
Dynamic visualization offers numerous advantages for organizations across industries. These include:
- Improved Decision-MakingInteractive tools enable faster, data-driven decisions. Teams can explore different scenarios and predict outcomes with greater confidence.
- Enhanced CollaborationShared dashboards foster collaboration among teams. Real-time updates ensure everyone works with the same data, reducing miscommunication.
- Increased EfficiencyAutomated reports save time and effort. Dynamic visualizations eliminate the need for manual updates, allowing teams to focus on analysis and strategy.
Modern data visualization platforms offer these capabilities, ensuring that businesses have access to the most advanced tools available. These platforms integrate seamlessly with existing systems, making adoption easier and more effective.
The Challenges of Adopting Dynamic Visualization
Despite its benefits, dynamic visualization presents challenges. Implementing new tools requires investment in technology and training. Data quality is another concern. Inaccurate or incomplete datasets can undermine the effectiveness of even the most advanced visualizations.Privacy and security also need attention. As visualizations become more dynamic and connected, safeguarding sensitive information becomes critical. Companies must ensure compliance with data protection regulations.
The Future: A Blend of Technology and Creativity
The future of data visualization lies at the intersection of technology and creativity. Machine learning and AI will continue to enhance predictive capabilities. Meanwhile, creative approaches will make data more engaging and intuitive.Immersive technologies like virtual reality (VR) may redefine how we interact with data. Imagine stepping into a 3D environment to explore complex datasets visually. These innovations will transform not just how we view data but how we understand and act on it.
Conclusion
From static charts to dynamic, interactive tools, data visualization is evolving rapidly alongside advanced data pipeline integration. The shift reflects a growing need for insights that are real-time, actionable, and customizable. Dynamic visualization tools offer businesses a competitive edge, enabling faster decisions and deeper understanding.
Embracing the future of data visualization means investing in the right technologies and fostering a culture of innovation. As tools become more sophisticated, they will empower organizations to turn data into a powerful driver of success. The journey from static to dynamic is far from over, but it holds immense promise for those ready to embrace the change.
No items found.
Ready to transform your data strategy?
You might also like
.png)
AI As a Paradigm Shift
Here’s something our team has been talking about. If your organization is investing in AI—pilots, platforms, use cases—but somehow the results still feel incremental instead of transformative, then keep reading.
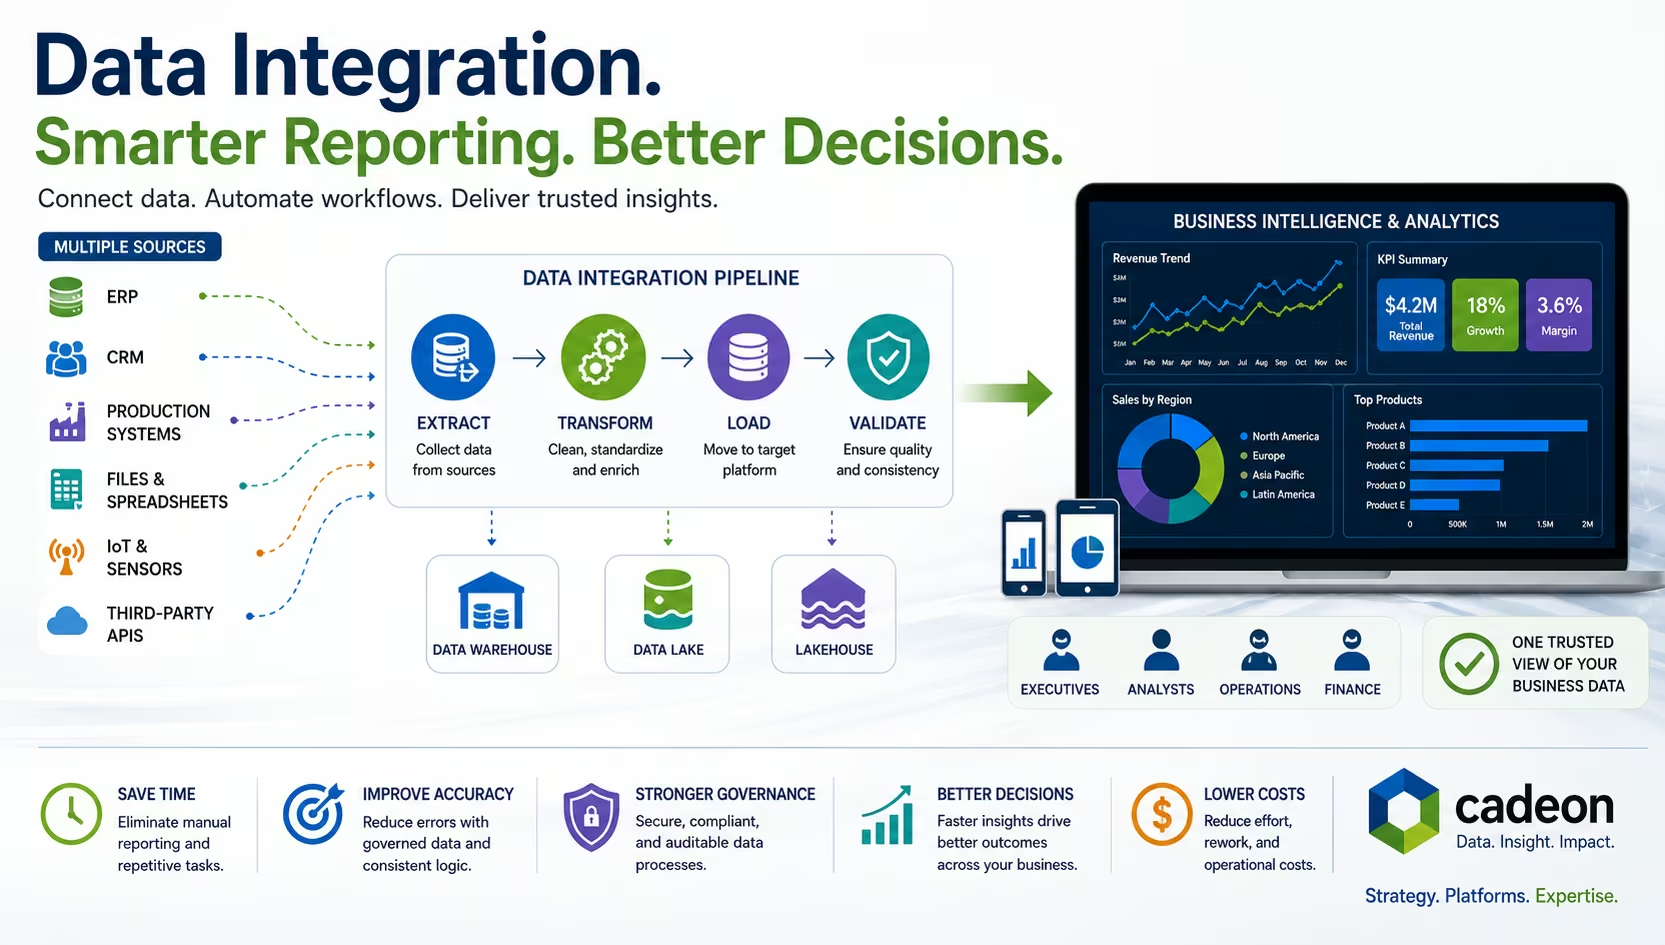
What Is Data Integration? Methods, Tools, and BI Explained