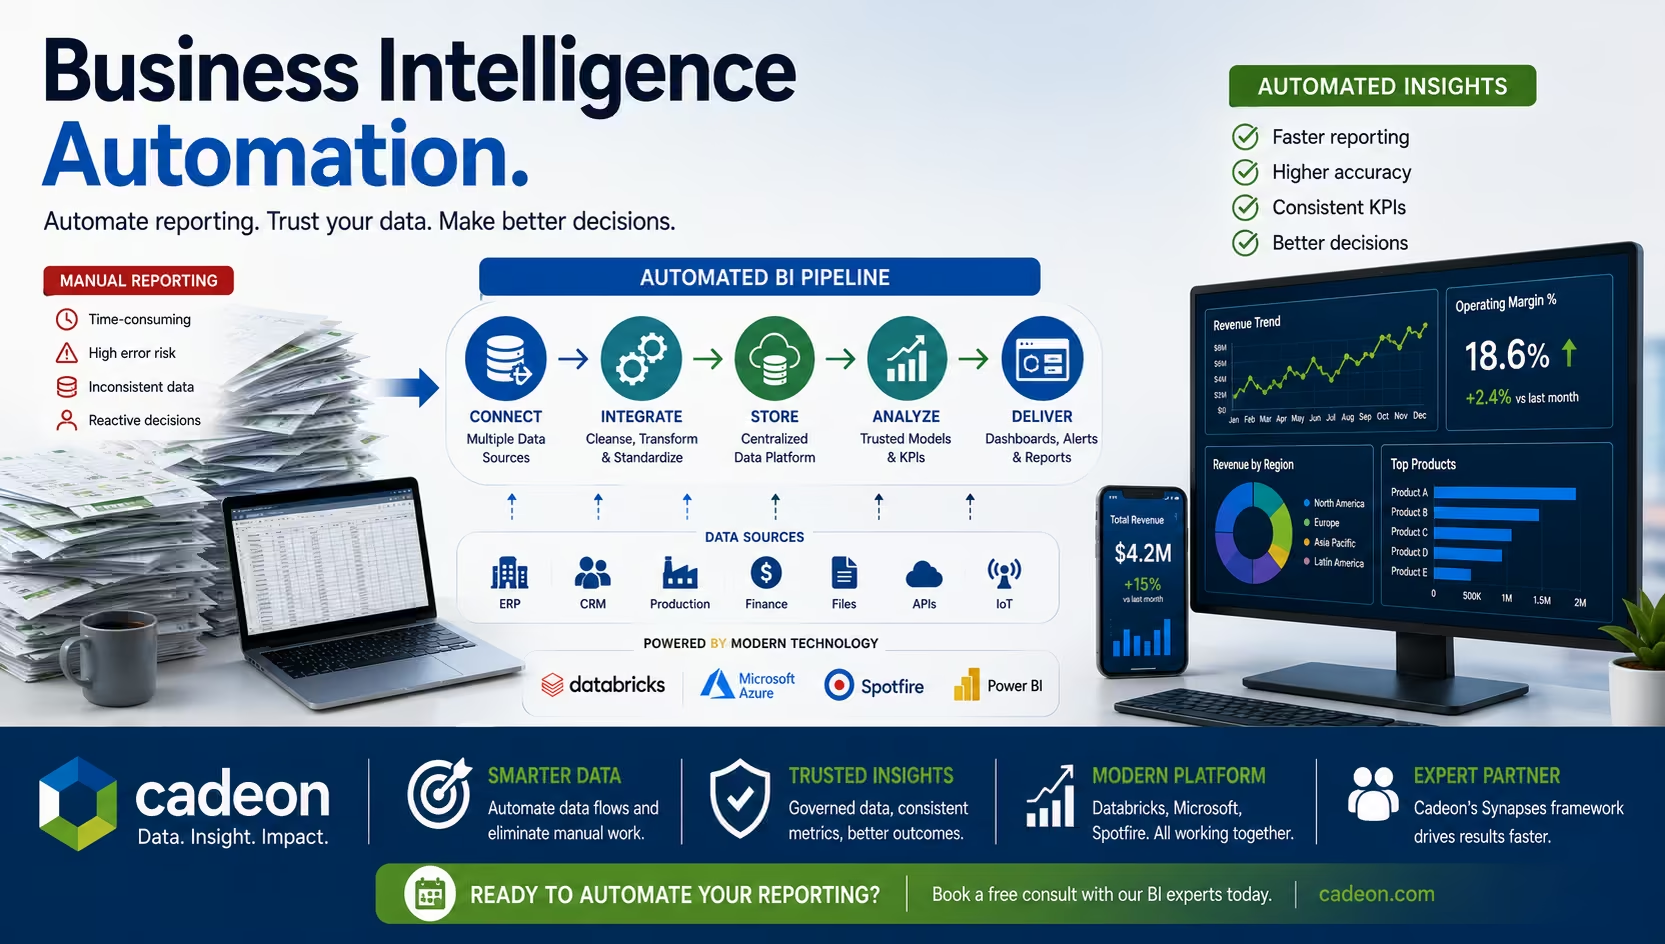
5 Reasons You Should Upgrade to Spotfire 10
Spotfire 10 not only provides an outstanding user experience for BI and Analytics; it pushes the border of BI by allowing for the analysis of streaming data from dozens of sources such as Kafka, MQTT, Salesforce Streaming, WITS, OsiPi, and many Capital Market Exchanges, alongside other TIBCO technologies such as FTL and EMS. Through specialized data analytics consulting, organizations can leverage Spotfire 10 to build high-performance real-time dashboards. It further allows the interconnectivity of streaming and historical data to provide insight across both the present and the past, while allowing static data to serve as vital context for streaming data (Tibco Community).
Here's our take on Spotfire 10:
- New UI
The new UI on Spotfire 10 is way more friendly to beginner Spotfire users. It walks you through how to start creating visualizations in Spotfire (rather than giving you a blank slate and a long toolbar of icons that don't have descriptions unless you hover over each one individually). Also, the concept of an Authoring Bar makes so much sense as this is where all the creation (authoring) happens. - Data Canvas
This is completely integrated into the product now. It can easily wrangle data, add rows/columns and edit them. Which is highly effective vs previously having to delete projects because there was no way of replacing data sources or editing the joins. The new UI on each step is also very user-friendly. - Data in Analysis Panel
Highly useful, the detailed properties on each column are easy to navigate and allow you to look at your distribution of data, data types, values in the column, and edit. Recommendations are also available now, and more powerful with AI built-in. It further can suggest relationships between different columns. - Files and Data Panel
This beautiful and highly intuitive process of adding new data to your analysis with one location to be able to add all that you need. - Natural Language Query
It makes it easier to mark certain values in a column.
No items found.
Ready to transform your data strategy?
You might also like
.png)
AI As a Paradigm Shift
Here’s something our team has been talking about. If your organization is investing in AI—pilots, platforms, use cases—but somehow the results still feel incremental instead of transformative, then keep reading.
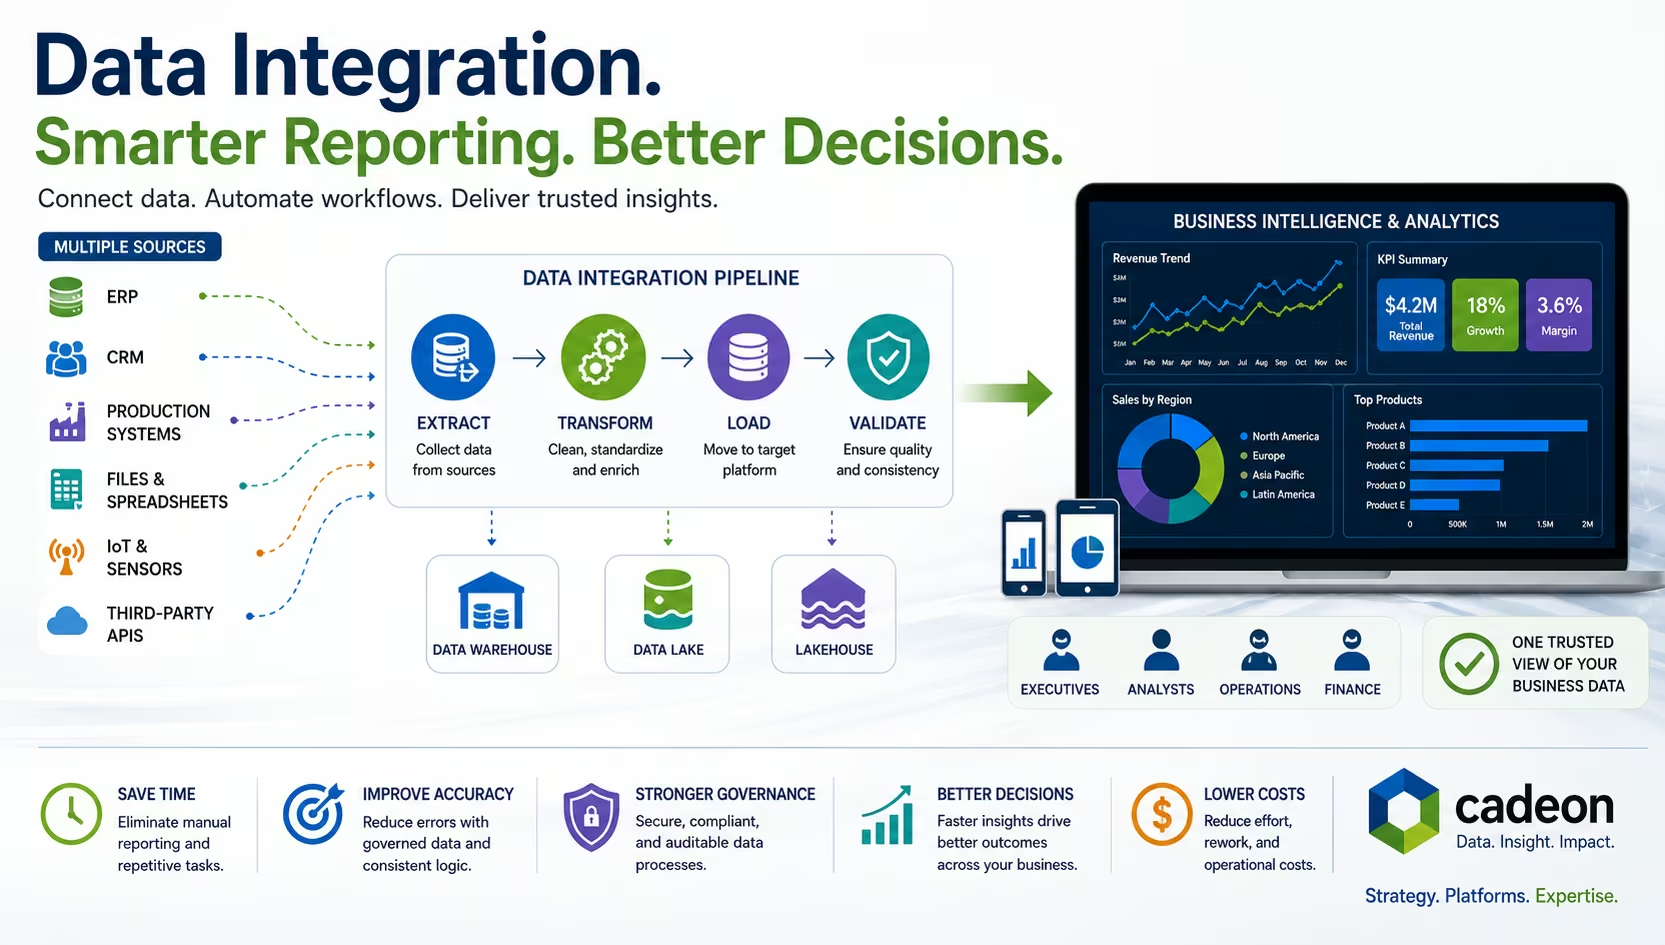
What Is Data Integration? Methods, Tools, and BI Explained