How Action Logs Can Unlock Your Organization’s Spotfire Usage

Have you ever wondered who is really using Spotfire in your company? We typically think that business users are the only ones interested in collecting and analyzing data. The engineers and analysts interpret this information to make the best possible decisions, and IT departments exist to provide them with access to the tools and data behind the scenes. However, when software purchasing and renewals come around, IT practitioners also share in the excitement and responsibility of being a critical decision-maker.Spotfire licenses don’t come free! No kidding, you say. But if your organization has different license types – Analyst, Business Author, and Consumer, you’ll find a huge price difference between each type. There’s certainly a cost-benefit analysis to consider. So how do you find out who’s really making the most of their Spotfire license? And does their license type fit their usage pattern?

Turning Information into Money
Customized Spotfire® Training Solutions To Create Insightful Data Visualisations For Your Business
Spotfire® is the most complete and advanced data analytics solution on the market, allowing businesses to explore and visualize new discoveries in data through immersive dashboards and advanced analytics. However, to harness the full potential of this platform, you require the proper training.At Cadeon, we offer fully customized Spotfire training programs at beginner, intermediate, and advanced levels. Our experienced consultants can help you master this program so you can begin enjoying incredible business benefits immediately.
"Cadeon has been supporting our Tibco Spotfire development and training over the last 12 months. Cadeon has been very helpful in developing visualizations within Spotfire and TDV implementation.”- Jim B.
How You Can Interpret Your Company’s Spotfire Usage To Get The Most Out Of Your Big Data
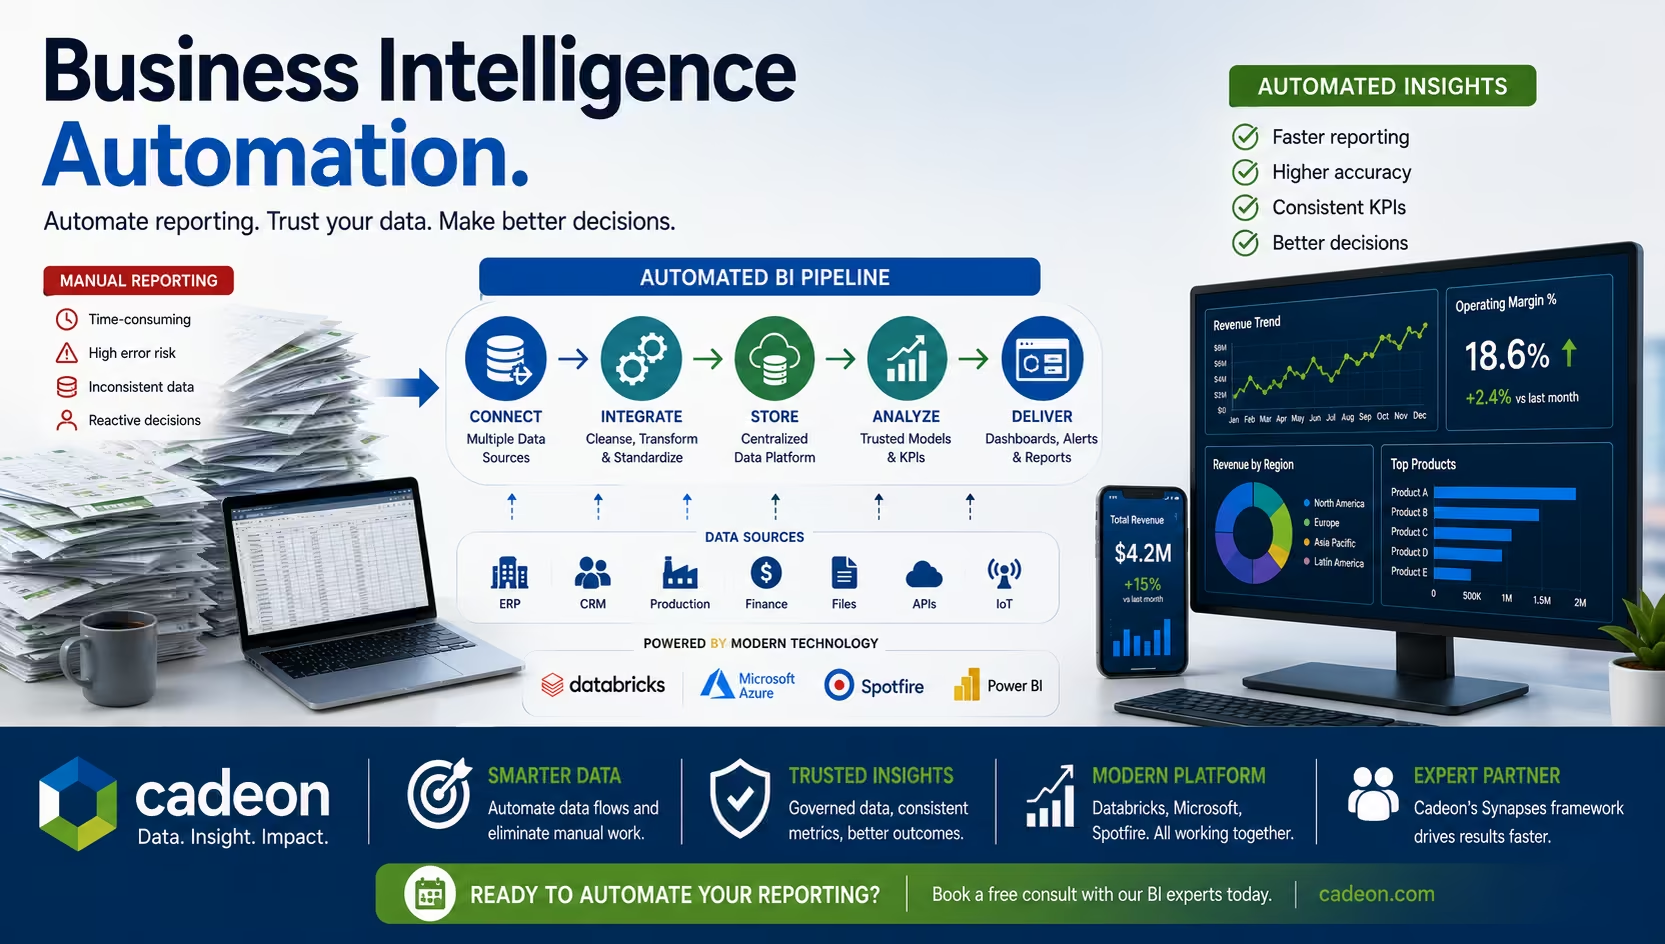
The Administration panel of the Spotfire Server provides a simple answer- it displays a list of users and their last log-in time. You can extract that into an Excel sheet, shine it up, and whip out a visualization to justify your license renewal decision. Is that it? Last log-in time is one way of looking at the data, but there can be more ways of interpreting “Spotfire usage”.Here are some of the most common ways of interpreting:
- How frequently does each person access Spotfire?
- How long do they remain on their Spotfire sessions?
- What about the usage of reports and data?
- Which data sources and information links are most used?
- Which Spotfire dashboards are most viewed?
- Are files being stored on the Library more often than network shared?
- Having the ability to look at the bigger picture when making a decision that could save thousands of dollars (and impress your boss) is a no-brainer.
Having the ability to look at the bigger picture when making a decision that could save thousands of dollars (and impress your boss) is a no-brainer. This is the juicy data that can be squeezed out of Action Logs.
While Not Automatically Enabled, Action Logs Are Easy To Turn On!
We recommend setting up a database for the logs to write to (similar to the Spotfire database where your Library resides). Now perhaps your organization already has Action Logs turned on, but you haven’t taken a look at the data and insights availableto extract.TIBCO provides a fantastic starting point. The Spotfire Server installation directory contains a zipped file that can be imported into the Spotfire Library, which creates all the Information Links and a set of visualizations for you. Point it to the Action Logs database and you’re basically done! Or use that digital experience platform as the starting point for creating your own visualizations.There are over 70 Information Links that get created, and just 2 are utilized in the default visualizations to answer the questions posed above. So really, you’re only scratching the surface! There’s even more data to uncover on Admin Changes, Automation Services, Data Functions, Scheduled Updates and Library Actions.
No items found.
Ready to transform your data strategy?
You might also like
.png)
AI As a Paradigm Shift
Here’s something our team has been talking about. If your organization is investing in AI—pilots, platforms, use cases—but somehow the results still feel incremental instead of transformative, then keep reading.
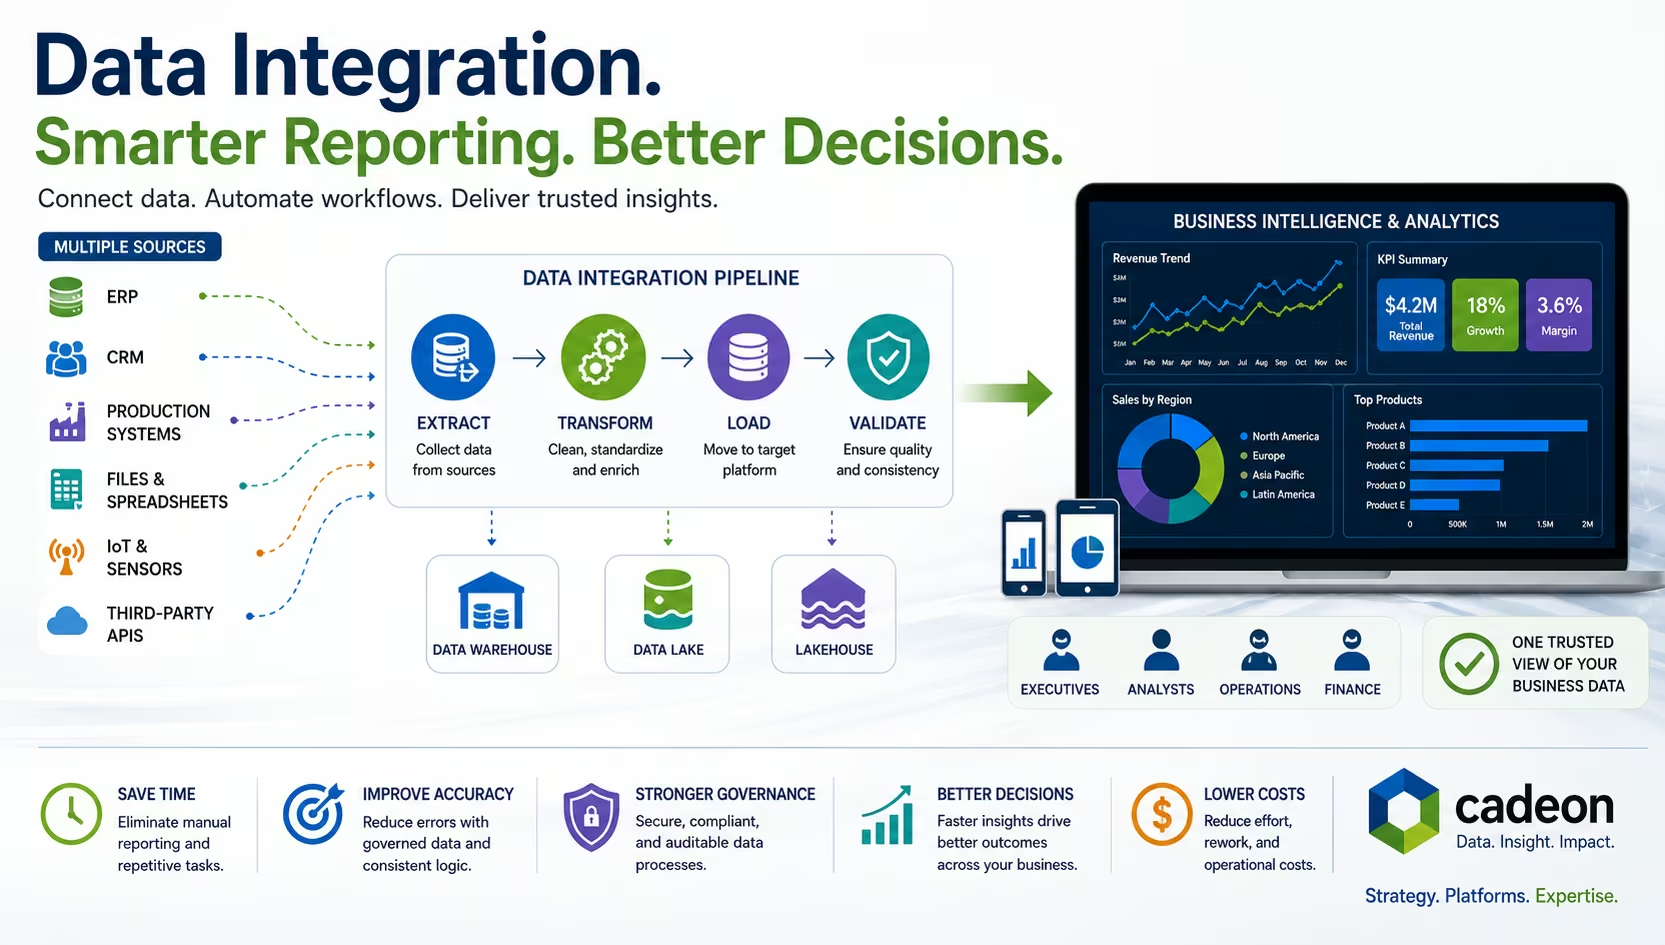
What Is Data Integration? Methods, Tools, and BI Explained