Power of Data Visualization With Virtualization
Are you looking to transform decision making within your organization and help your business grow? Here’s why you should attend the Power of Data Visualization with Virtualization Webinar event. This informative and FREE Online SpotFire User Group Webinar event will give you the tools you need to succeed in today’s digital age.
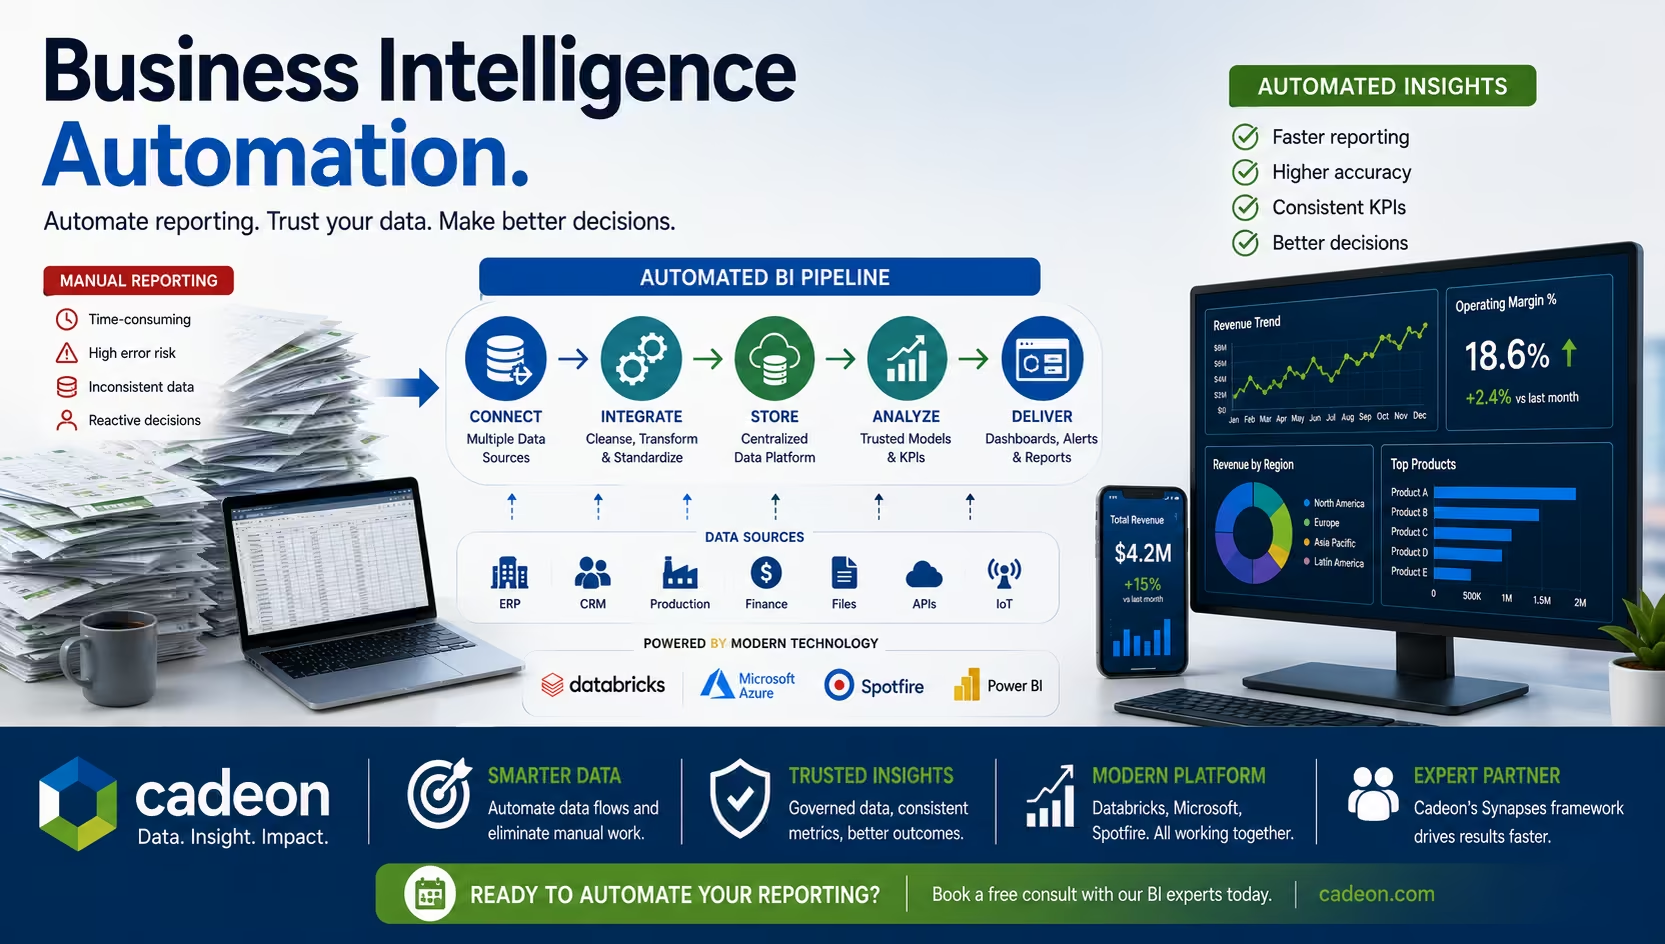
Data visualization, which refers to the representation of data in a pictorial or graphical format, allows business owners to understand complex concepts, as well as identify new trends and patterns quickly and easily.
Data visualization can help your business thrive in today’s digital age because it allows for:
- Swift action and decision making
- Direct and customized interaction with data
- Marketing campaigns that resonate fully with customers
Stay Ahead of the Competition and Attend the Cadeon and Tibco FREE Online Spotfire Webinar Event on the Power of Data Visualization with Virtualization
We’re excited to announce that Cadeon and Tibco’s FREE Online SpotFire Webinar event is approaching! This Webinar event will feature important updates from Cadeon and TIBCO, and a special customer spotlight, Aaron Hugen. During this event, he will share his secrets of how to take full advantage of SpotFire’s GIS and data visualization capabilities to streamline business practices, specifically in energy acquisitions and divestitures.
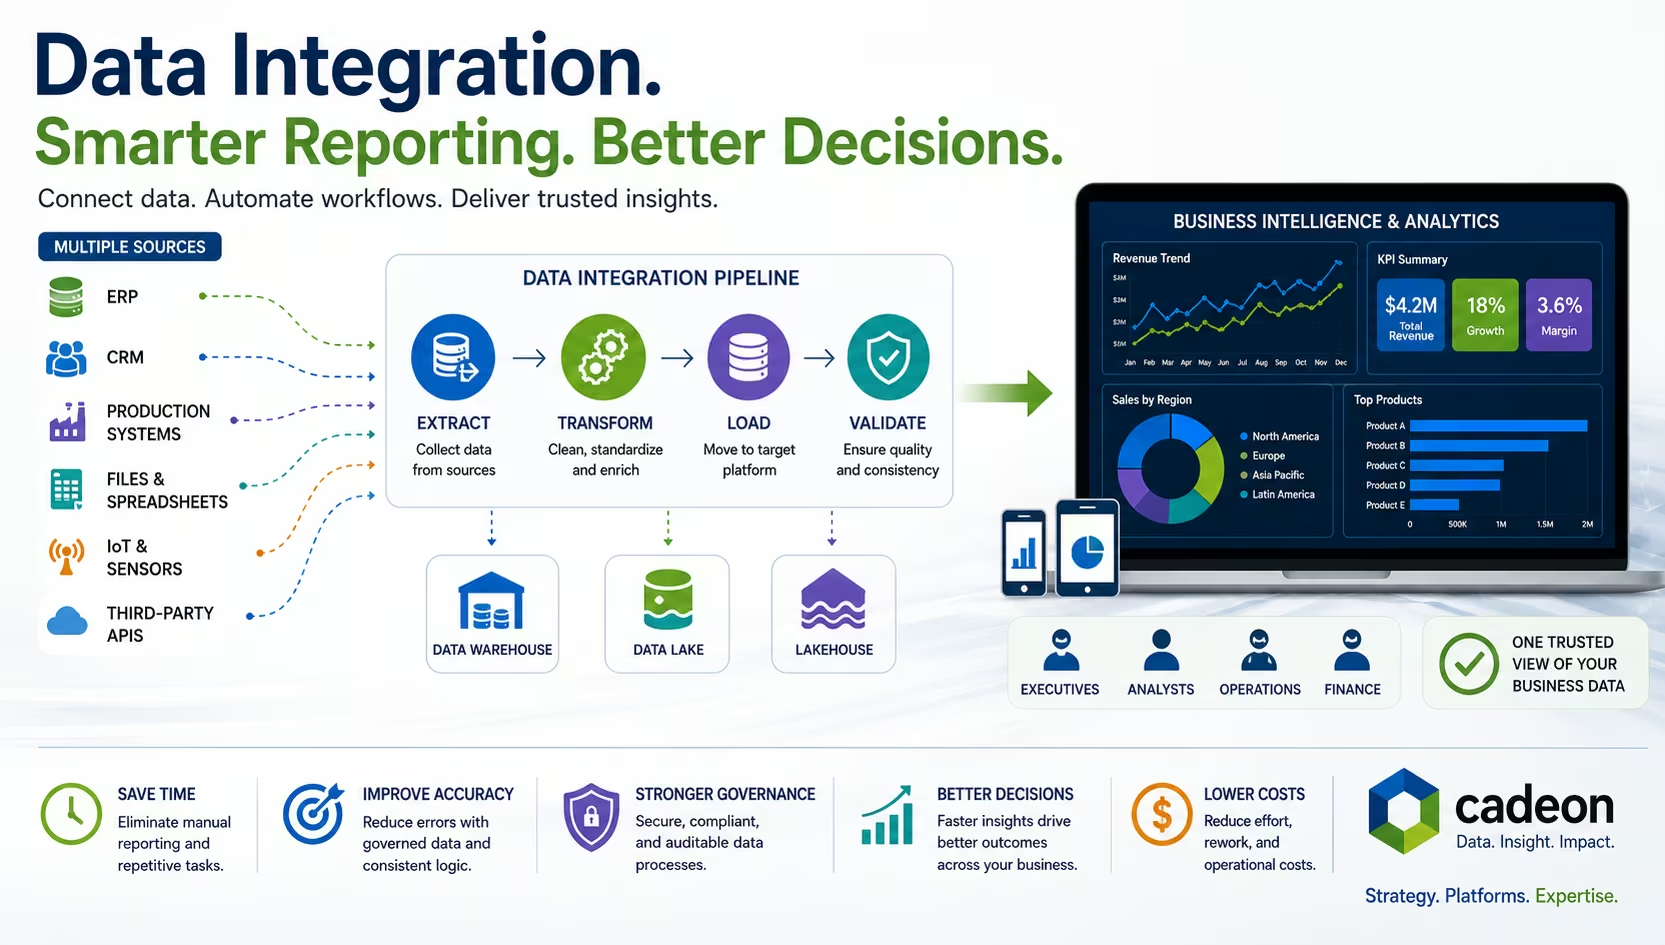
If you’re interested in advanced analytics and technologies like data pipeline integration that enable digital transformation and allow for greater business success, you don’t want to miss this event!
Event Information: Where, When, and How to Register
- When: This informative Online Webinar event will be held on the morning of Wednesday, March 25th between 10:00 am and 11:00 am.
Harness the Transformative Power of Your Business Data Today
You can register for this FREE and informative Webinar event here. Alternatively, if you have any questions, please don’t hesitate to let us know! You can reach us at info@cadeon.com, or by phone at 720-601-3324.
This event is sure to be informative and engaging, and we hope to see you there!
No items found.
Ready to transform your data strategy?
You might also like
.png)
AI As a Paradigm Shift
Here’s something our team has been talking about. If your organization is investing in AI—pilots, platforms, use cases—but somehow the results still feel incremental instead of transformative, then keep reading.
What Is Data Integration? Methods, Tools, and BI Explained