Business Intelligence vs Data Analytics Key Differences 2026

If you lead a data‑driven team, you’ve heard the debate: business intelligence vs data analytics, where should we focus first? One side wants more dashboards and self‑service reporting; the other pushes for AI and advanced models. Executives just want trustworthy numbers and faster decisions.
Under the jargon, the question is simple: how do you turn your data into business value without blowing the budget, and should your next dollar go into BI, data engineering, or analytics talent?
TL;DR
Business intelligence (BI) turns trusted, governed data into reports and dashboards for broad business audiences. Data analytics digs deeper into patterns, root causes, and predictions, often using more advanced techniques and smaller expert teams. High‑performing organizations don’t pick one; they combine both on a modern data platform.
Table of contents
- Quick definitions at a glance
- What is business intelligence?
- What is data analytics?
- Business intelligence vs data analytics: 5 key differences
- Data analytics vs business intelligence: use cases
- How BI and analytics work together in a modern stack
- Why “BI vs analytics” is the wrong question
- Where to invest next: a quick self‑check
- How Cadeon can help
- FAQs
- Key takeaways
Quick definitions at a glance
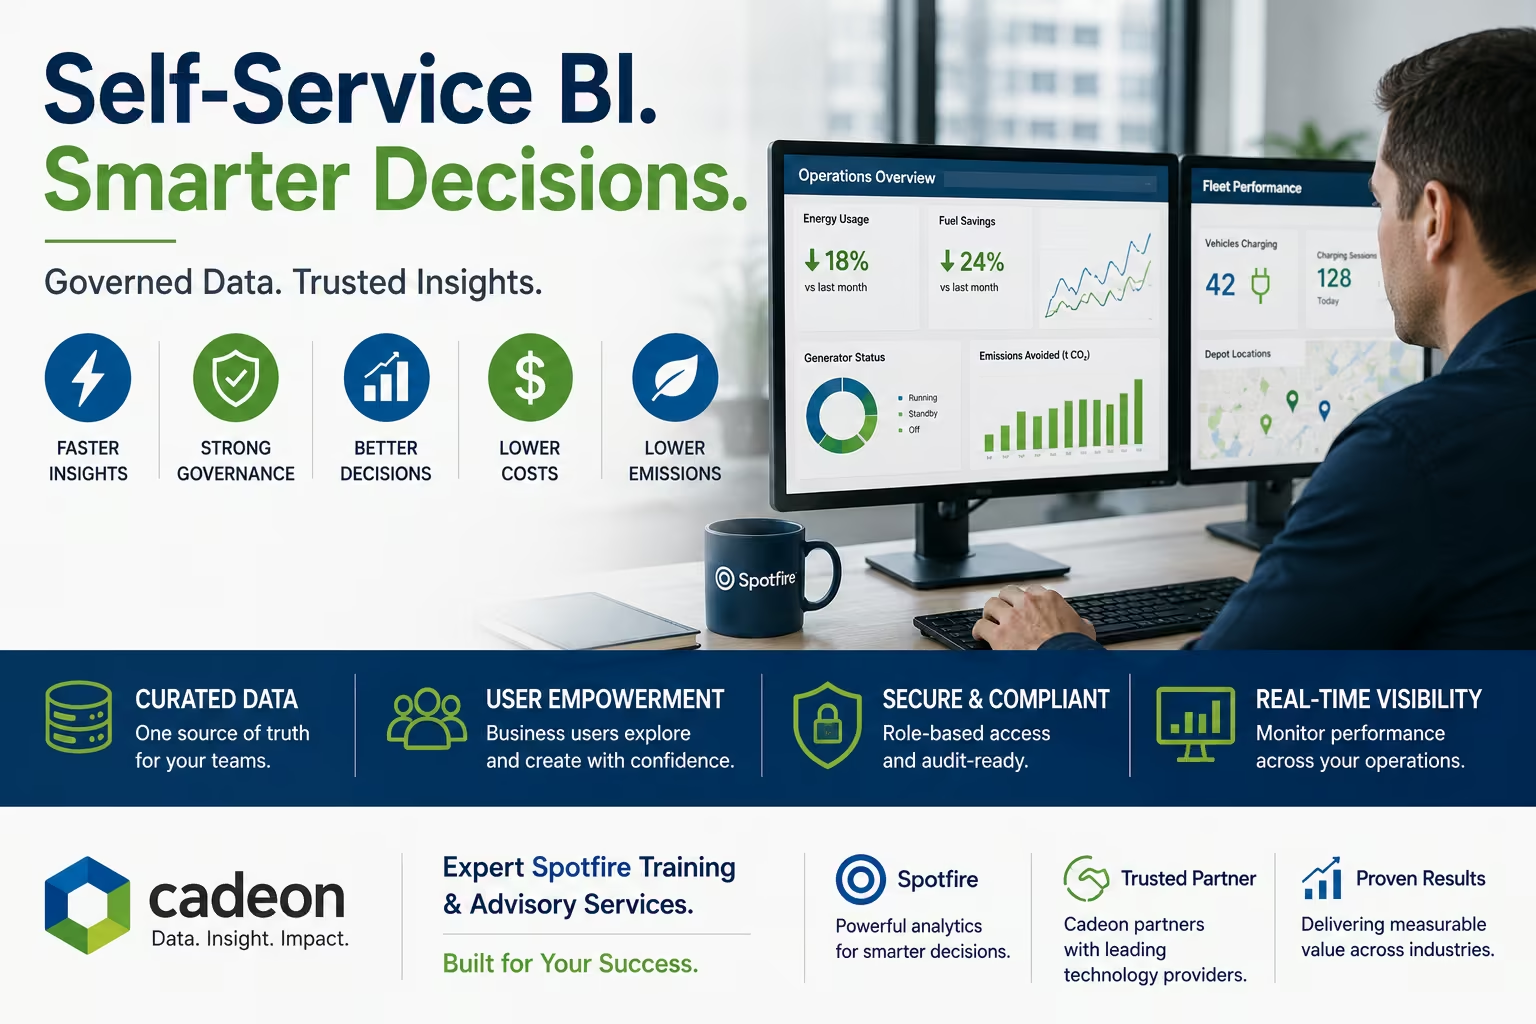
- Business intelligence (BI) is about delivering trustworthy, standardized views of the business, usually as dashboards, scorecards, and reports, so that leaders and front‑line teams can monitor performance and answer day‑to‑day questions.
- Data analytics is about exploring data to understand why things happen and what might happen next, often using statistical methods, machine learning, or advanced visual analysis.
Both rely on solid data engineering, governance, and platforms like Spotfire or Microsoft Power BI. Analyst firms such as Gartner and vendors like Tableau now track tools that increasingly blend classic reporting with advanced analytics and AI‑assisted features.
What is business intelligence?
Business intelligence turns raw data into standardized reporting, recurring board packs, monthly financials, production dashboards, and daily operations scorecards.
Typical BI outputs
- Executive and operational dashboards (KPIs, trends, alerts)
- Standard reports (financial statements, regulatory reports)
- Self‑service views and ad hoc filters on governed data
- Mobile views for supervisors and field teams
Under the hood, BI usually pulls from a data warehouse, semantic model, or data mart with clearly defined metrics. Tools such as Spotfire and Power BI sit on top to provide visualization, governance, and sharing.
When BI shines
- You need one version of the truth for KPIs across finance, operations, and commercial teams.
- Leaders need repeatable views (yesterday vs today, month‑to‑date, year‑to‑date).
- You must meet regulatory or audit requirements with traceable, governed data.
- Hundreds or thousands of people need simple, reliable dashboards, not advanced models.
Think of BI as the organization’s instrument panel, if it’s wrong, everyone steers in the wrong direction.

What is data analytics?
Data analytics goes beyond “What happened?” into “Why did it happen, and what should we do next?” It is usually done by data analysts, data scientists, or advanced business users.
Types of analytics
- Descriptive – What happened? (e.g., production volumes by well over time)
- Diagnostic – Why did it happen? (root cause of downtime or cost overruns)
- Predictive – What is likely to happen? (failure prediction, demand forecasting)
- Prescriptive – What should we do? (optimal maintenance schedule, pricing actions)

Analytics may still use Spotfire or Power BI as the workbench, but often taps into data lakes, time‑series stores, or streaming data and calls out to Python, R, or cloud ML services.
When data analytics shines
- You have specific, high‑value questions (e.g., reduce downtime, improve drilling, cut days sales outstanding).
- The answers are not obvious from standard reports.
- You are ready to experiment with models and iterate with domain experts.
- You want to move from reporting the past to optimizing the future.
“BI keeps everyone honest about what’s happening. Analytics helps you change what happens next.”
Business intelligence vs data analytics: 5 key differences
1. Time horizon: past vs future
- BI focuses on the recent past and current state: yesterday’s production, this month’s revenue, current backlog.
- Analytics leans toward the future: forecasts, “what‑if” scenarios, risk simulations, recommended actions.
2. Audience: broad vs specialized
- BI is built for broad consumption, executives, supervisors, field teams, finance, operations.
- Analytics is usually performed by data specialists and power users, then translated back into actions for the wider business.
3. Questions they answer
- BI questions: “What are our top 10 cost drivers by plant?” “How did we perform vs budget?”
- Analytics questions: “What conditions predict that cost spike?” “Which actions are most likely to improve margin?”
4. Technology emphasis
- BI stack: data warehouse, semantic layer, governed metrics, standardized dashboards.
- Analytics stack: data lake or lakehouse, feature engineering, notebooks, ML models, specialized algorithms.
5. Cadence and governance
- BI values stability, repeatability, and data quality. Changes are controlled and documented.
- Analytics values experimentation and speed. You test, learn, and refine, then productionize the winners into BI.
Healthy data programs treat BI and analytics as a loop: analytics discovers insights; BI turns the best of them into standardized metrics and dashboards.
External benchmarks back this up: Forrester found that companies which systematically turn data into decisions grow about eight times faster than global GDP (around 27% annually), underscoring the ROI of combining BI and analytics. McKinsey likewise found that organizations that effectively harness analytics in sales and marketing are far more likely to achieve above‑average growth.
Data analytics vs business intelligence: use cases
Here are common scenarios from industries Cadeon works with; explore more in our industry data and analytics solutions.
Executive & operational reporting (BI‑led)
- Integrated operations dashboards for production, downtime, and HSE by asset.
- Finance scorecards with revenue, cost, and margin by business unit.
- Regulatory and compliance reports from a governed data warehouse.
Optimization and forecasting (analytics‑led)
- Production and throughput forecasting by well, plant, or line.
- Predictive maintenance on pumps, compressors, or manufacturing equipment.
- Customer churn or credit risk models for financial services.
These typically start as analytics projects; once proven, predictions are surfaced through BI dashboards.
Risk, compliance & cyber analytics
In cyber security analytics, BI dashboards summarize alert volumes, incident types, and SLA performance, while analytics models detect anomalies and suspicious behaviour in real time.
AI & machine learning scenarios
Modern tools like Spotfire blend BI and analytics through expert data analytics consulting: analysts build machine learning models in Python or R and surface predictions as familiar visuals for business users, so the line between data analytics and business intelligence blurs, in a good way.
Mini case stories: BI and analytics in action
- Energy producer. An energy client replaced spreadsheet‑based operational reports with automated Spotfire dashboards on a governed data layer, making reporting about 75% faster, cutting manual effort by roughly 40%, and improving dashboard accuracy by around 30% (case study).
- Sports and entertainment operator. A venue operator integrated data from ticketing, point‑of‑sale, and operations systems into a single real‑time analytics platform so BI dashboards and analytics could guide same‑day staffing, inventory, and offers (case study).
How BI and analytics work together in a modern stack
High‑performing organizations run BI and analytics on a shared platform.
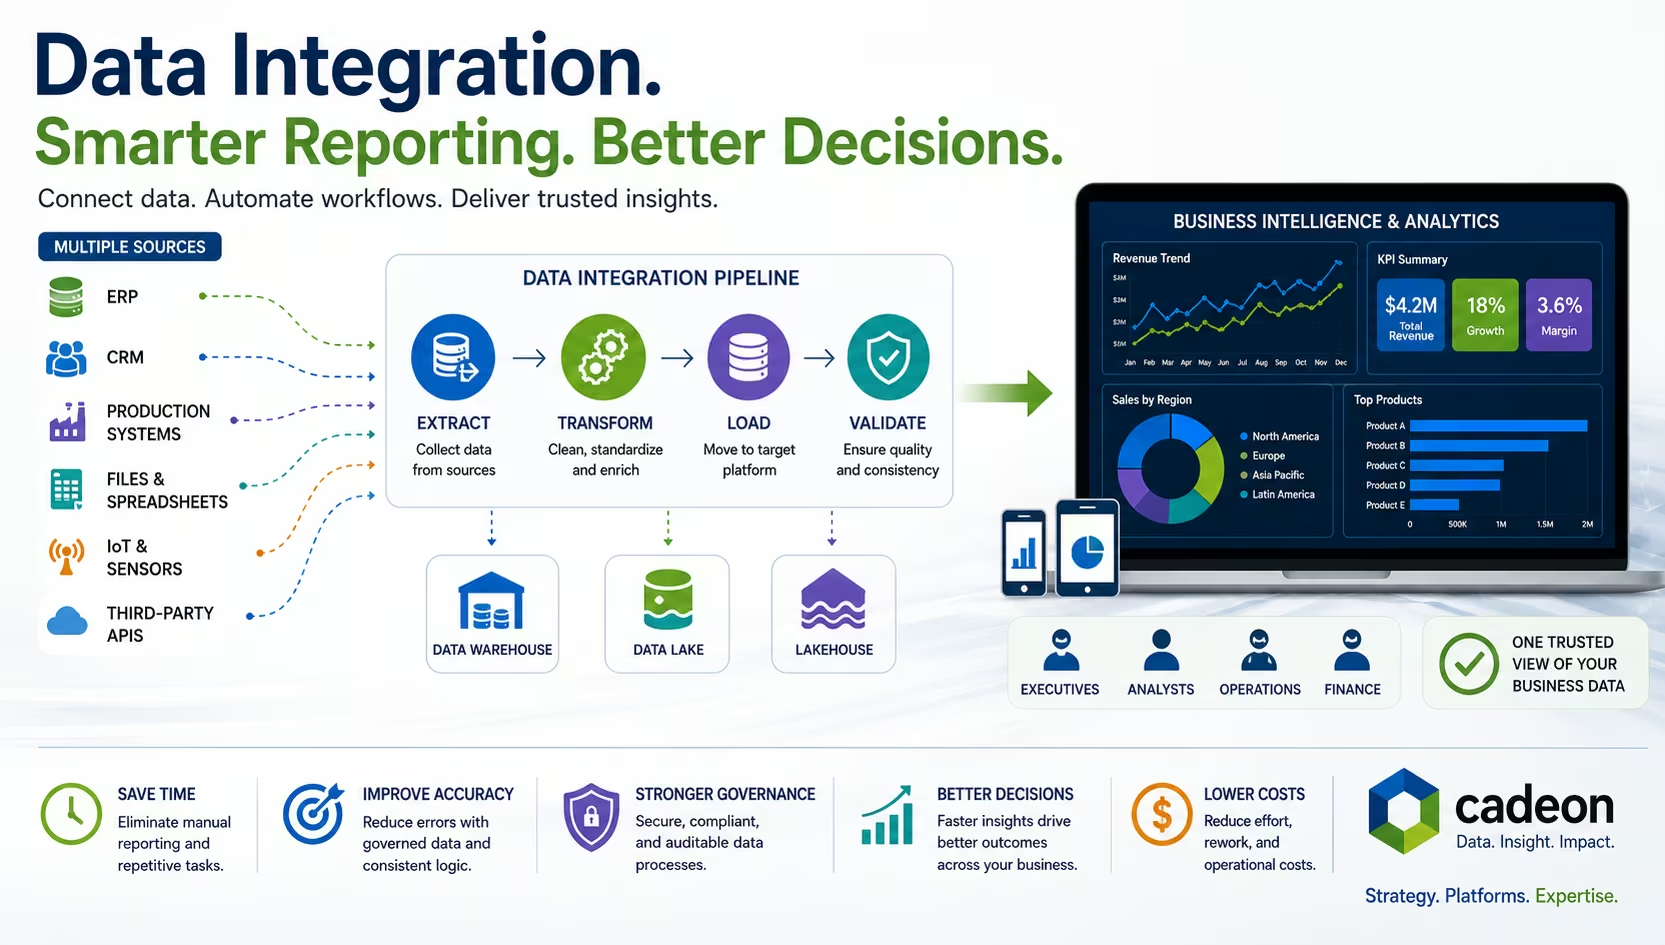
From source systems to decisions
- Source systems – ERP, EAM, SCADA, trading, CRM, EHR, spreadsheets.
- Data integration & virtualization – Bring data together with ETL, virtualization, or streaming, often without copying.
- Curated layers – Data warehouse and semantic models support BI; data lake or lakehouse supports advanced analytics.
- BI layer – Governed Spotfire / Power BI dashboards, reports, and self‑service views.
- Analytics layer – Exploratory notebooks, ML experiments, and advanced visual analytics.
- Feedback loop – Proven analytics become new KPIs and dashboards.

The BI–Analytics Decision Loop (Cadeon framework)
Cadeon’s BI–Analytics Decision Loop shows how BI and analytics reinforce each other in a closed loop:
- Instrument with BI. Standardize metrics and dashboards so everyone sees the same facts in near real time.
- Experiment with analytics. Use models and advanced analysis to test hypotheses, find leading indicators, and design better actions.
- Operationalize and improve. Feed the winning analytics back into BI as new KPIs, alerts, and workflows, then repeat.
Why “BI vs analytics” is the wrong question
Teams often frame this as a budget choice, dashboards or data science. In reality, BI instruments the business with standardized metrics and dashboards, while analytics experiments on the same data to find leading indicators and better actions. The better question is: where is our loop weakest today, instrumentation (BI), experimentation (analytics), or the underlying data architecture?
Where to invest next: a quick self‑check
If you’re choosing between new BI tools, more analysts, or modernizing your data, use this quick checklist.
Step 1: Assess your BI foundation
- Do executives and managers trust the numbers in your current reports?
- Can business users answer 80% of their questions with existing dashboards, or are they stuck in spreadsheets?
- Are metric definitions and data sources documented and governed?
If you answered “no” to most, strengthen BI, data modeling, quality, and dashboards. It usually delivers the fastest ROI.
Step 2: Assess your analytics maturity
- Do you have clear, high‑value use cases (like reducing unplanned downtime or optimizing capital spend)?
- Is there a team, internal or partner, who can experiment with models and work closely with domain experts?
- Can you operationalize models (e.g., surface predictions into BI tools and workflows)?
If yes, you’re ready to lean further into advanced analytics and AI on top of a solid BI base.
How Cadeon can help
Cadeon helps energy, utilities, manufacturing, and financial services organizations build governed BI platforms and advanced analytics solutions with Spotfire, Microsoft, and modern data architectures, often starting with a focused engagement such as our Synapses framework or $10K Digital Transformation Challenge.
Book a Free Consult
FAQs: business intelligence vs data analytics
Is business intelligence the same as data analytics?
No. BI focuses on standardized reporting and dashboards for broad audiences; analytics focuses on deeper exploration and prediction, usually by specialized teams. They share data and tools but serve different purposes.
Which should we implement first: BI or data analytics?
For most organizations, a solid BI foundation comes first. You need reliable, governed data and common KPIs before advanced analytics can scale. That said, targeted analytics pilots can run in parallel where there is a strong business sponsor and clear value.
Can we use the same tools for BI and analytics?
Often, yes. Platforms such as Spotfire support governed BI dashboards and advanced analytics workflows in one environment, especially when paired with modern data platforms like Azure or Snowflake.
Who should own BI and who should own analytics?
BI is typically owned by a central data or analytics function with strong business partnership, while analytics may sit with a data science team, COE, or embedded analysts in key business units. What matters most is clear ownership of data quality, models, and decision rights.
How do we get started without a massive multi‑year project?
Pick a single, high‑value use case, for example, “production reporting for one asset” or “cash flow visibility by business unit”, and build an end‑to‑end slice: data integration, BI dashboards, and, where relevant, analytics. Cadeon’s Digital Transformation Challenge is structured exactly this way.
Key takeaways
- Business intelligence provides trusted, repeatable reporting and dashboards for large audiences.
- Data analytics explores patterns, root causes, and predictions, often for targeted, high‑value questions.
- The smartest move is not “BI vs analytics” but BI and analytics on a shared, modern platform.
- Most organizations see the fastest return by fixing data quality and BI foundations, then layering analytics on top.
- If you’re unsure where to start, partner with experienced business intelligence advisors who have done this before and can show results quickly.
Ready to transform your data strategy?
You might also like
What Is Data Integration? Methods, Tools, and BI Explained
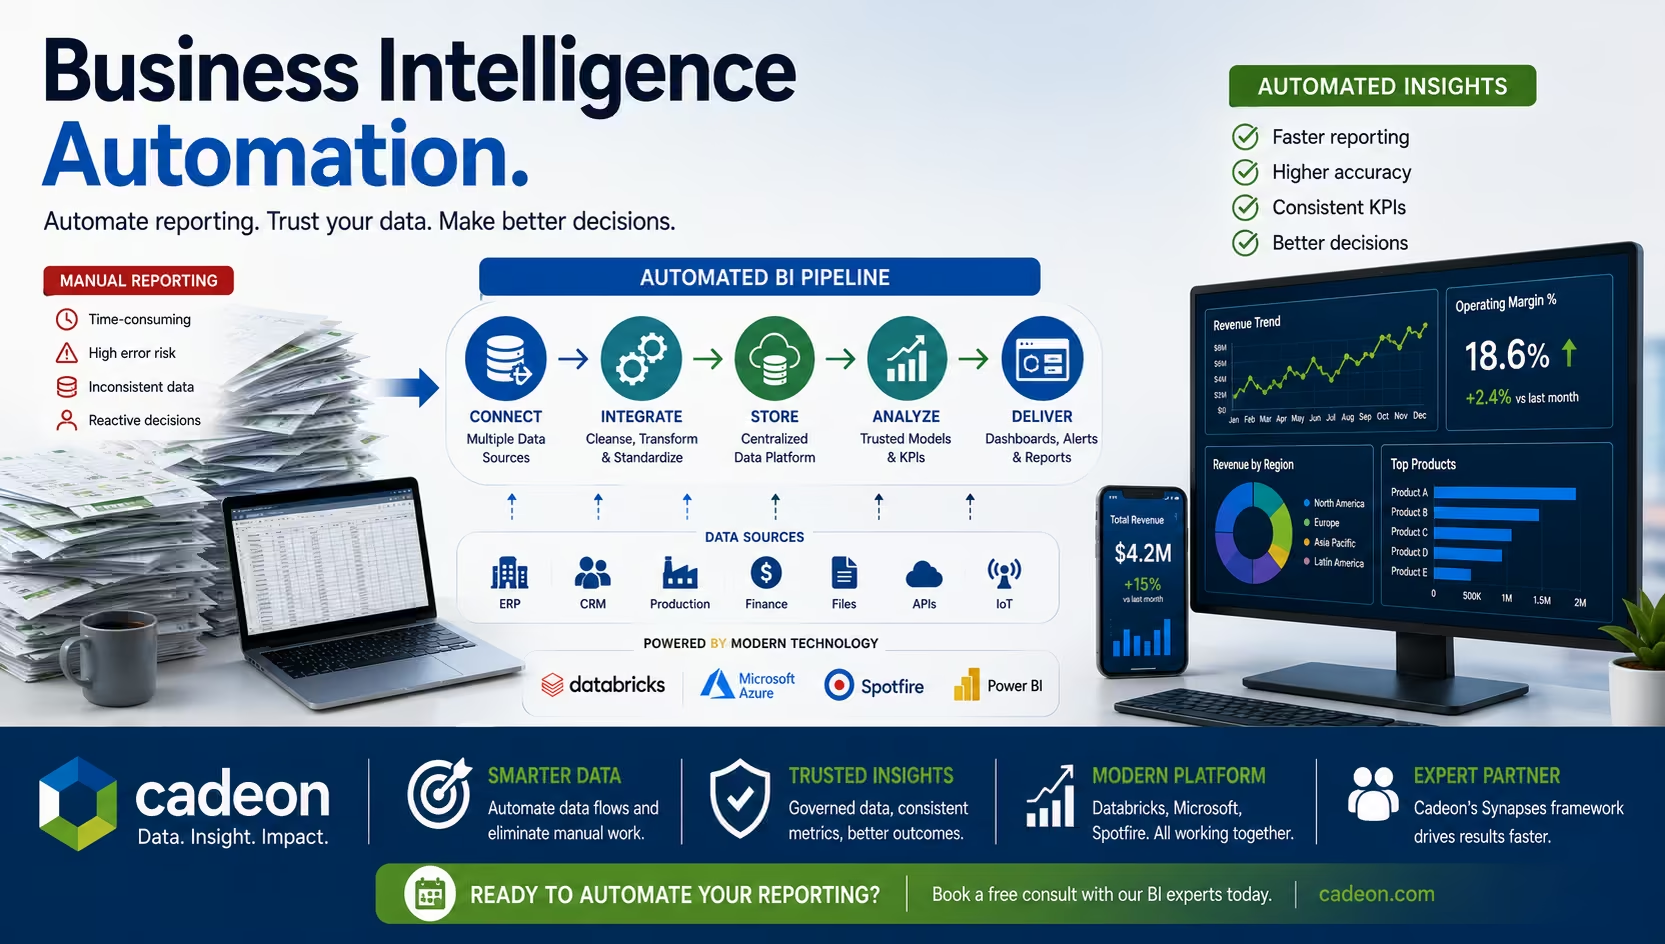
Business Intelligence Automation for Faster Reporting & Insights