What is Predictive Analytics? Models, Examples & Business Benefits
Last quarter’s reports are useful, but they don’t tell you who’s about to churn, which asset will fail next, or where margins are quietly leaking away. That’s where predictive analytics comes in. Instead of only explaining what happened, it uses patterns in your historical data to estimate what is likely to happen next, so your teams can step in early, not react late.
If you lead IT, operations, or analytics, you’ve probably wondered whether you’re getting the most from all that data. The good news: you don’t need a PhD or a giant data science lab to start. This guide explains how predictive analytics works in plain language and where it typically delivers the fastest value.

Table of contents
- What is predictive analytics?
- How predictive analytics works
- Common predictive analytics models
- Benefits for your business
- Predictive analytics business use cases
- Getting started with predictive analytics
- Predictive analytics FAQ
- About Cadeon
- Key takeaways
TL;DR
- What is predictive analytics? Using historical data, statistics, and machine learning to estimate future outcomes.
- Why it matters: Shifts teams from reactive reporting to proactive decisions in operations, finance, and customer experience.
- Key benefits: Lower downtime, smarter capital spend, reduced risk, and higher customer retention.
- Best starting point: One clear business question, good data foundations, and a focused proof of value.
What is predictive analytics?
In plain language, predictive analytics is the practice of using data to answer questions like “what is likely to happen next if nothing changes?” and “which decision gives us the best odds of a good outcome?”
More formally, it combines:
- Historical data (transactions, sensor readings, production logs, CRM activity),
- Statistical methods and machine learning algorithms,
- to estimate the probability of future events.
Common examples include churn prediction, demand forecasting, predictive maintenance, credit risk scoring, and early-warning models for safety incidents. For reference-style definitions, see the predictive analytics entry on Wikipedia and IBM’s overview of predictive analytics.
If descriptive analytics tells you what happened and diagnostic analytics tells you why it happened, predictive analytics helps you answer what is likely to happen next so you can plan ahead.
How predictive analytics works: from raw data to foresight
At a high level, a predictive project usually follows these steps:
- Frame the question. For example: “Which wells are most likely to fail in the next 30 days?” or “Which customers are at high risk of leaving?”
- Collect and prepare data. Pull information from systems like ERP, SCADA, CRM, or ETRM, then clean and join it. Cadeon often uses data virtualization to bring these sources together without heavy lifting on every system.
- Engineer features. Create useful signals such as rolling averages, lagged values, utilization ratios, and flags for unusual events.
- Train and validate the model. Test different approaches and hold out part of the data to check how well the model generalizes.
- Deploy into the business. Send predictions into dashboards, alerts, or workflows so field teams, planners, and leaders can act.
- Monitor and refine. As conditions change (prices, regulations, equipment, customer behaviour), refresh and recalibrate models.

Introducing the Q–D–M–A framework
At Cadeon, we use a simple, repeatable mental model for predictive projects: Q–D–M–A: Question → Data → Model → Action.
- Question: Start with one measurable outcome (like downtime, churn, or margin) and a clear time horizon.
- Data: Identify and connect the few data sources that truly influence that outcome instead of trying to integrate everything at once.
- Model: Choose and train a model that balances accuracy with transparency so domain experts can understand and trust it.
- Action: Embed outputs into dashboards, alerts, and workflows so people can make better decisions in the tools they already use.
This framework lines up with the predictive analytics lifecycle:
Question → Data → Model → Deployment → Monitoring
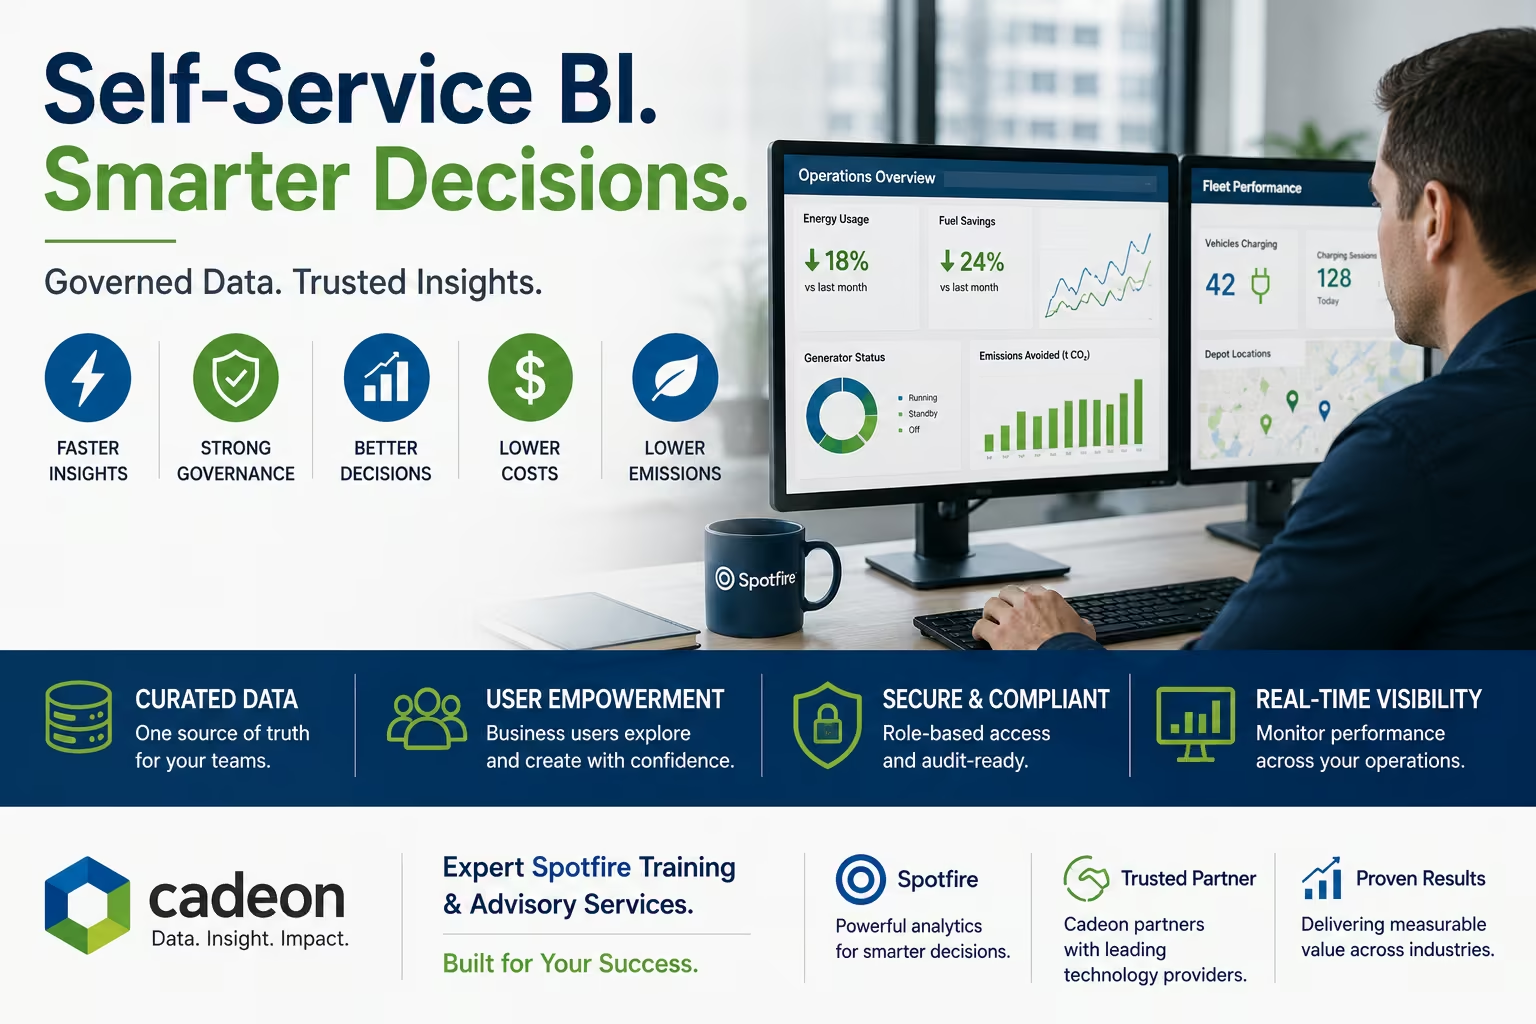
Modern tools like Spotfire and the Microsoft analytics stack make it possible to plug models directly into visual dashboards, so your teams see predictions next to the context they already use every day.
Common predictive analytics models (in plain English)
Different predictive analytics models answer different types of questions, and most organizations use a mix that evolves over time.
1. Regression models
Regression models estimate a number, such as production volume next month, expected time to failure, or likely customer lifetime value.
2. Classification models
Classification models sort things into categories. Typical questions:
- “Will this transaction be fraudulent: yes or no?”
- “Is this customer high, medium, or low churn risk?”
- “Is this loan application likely to default?”
3. Time-series forecasting
Time-series models focus on data that changes over time: prices, throughput, inventory, power load, or patient volumes.
4. Clustering and segmentation
Clustering finds groups that behave in similar ways, without pre-labelled categories. That might mean customer segments with similar buying patterns or equipment that tends to fail in the same way.
5. Recommendation and uplift models
These models suggest next best actions: which offer to show which customer, which work order to schedule first, or which intervention gives the best uplift in production.
Whether your team builds these in Python, R, or within Spotfire analytics dashboards, the goal stays the same: reliable signals that the business trusts and actually uses.
Which model fits which business question?
Use this quick reference to match common business questions to the model types above.
Benefits of predictive analytics for your business
Done well, predictive analytics shifts conversations from debating whose spreadsheet is right to focusing on trade-offs and actions.

- Fewer surprises. Catch problems early from equipment failures to cash-flow gaps.
- Higher asset uptime. Predictive maintenance models help schedule work before breakdowns, which is especially valuable in energy, utilities, and manufacturing.
- Smarter capital and inventory planning. Better forecasts lead to better timing for investments and stock levels.
- Reduced risk and losses. Think fraud detection, credit risk scoring, and early-warning indicators for safety events.
- Happier customers. Churn and next-best-offer models keep high-value relationships on track.
“The real win is moving from ‘What happened?’ to ‘What should we do next?’ and doing it with data your whole team trusts.”
Independent research from firms like McKinsey and Gartner shows that organizations using advanced analytics at scale tend to outperform peers on profitability and efficiency. Cadeon has seen the same pattern in practice, with clients identifying hundreds of millions of dollars in opportunities and savings.
Key stats
- Companies that embed big data and analytics into their operations have been shown to achieve around 5% higher productivity and 6% higher profitability than peers. (McKinsey)
- The global predictive maintenance market is projected to grow rapidly; one forecast from TechSci Research estimates an increase from about USD 4.3 billion in 2020 to more than USD 22 billion by 2026.
Predictive analytics business use cases
Here are some of the most common ways mid-sized and enterprise organizations put predictive models to work.
Energy, utilities, and oil & gas
- Predictive maintenance on compressors, pumps, and rotating equipment.
- Production forecasting at the well, field, or asset level.
- Pipeline integrity and leak risk scoring using sensor data and inspection history.
- Power load forecasting for generation and transmission planning.
Manufacturing and supply chain
- Quality risk prediction based on process parameters and supplier data.
- Demand forecasting at SKU or product-family level.
- Inventory and replenishment optimization across warehouses and channels.
- Throughput and bottleneck prediction to support scheduling decisions.
Other regulated industries (financial services and healthcare)
- Credit and underwriting risk models for lending and insurance portfolios.
- Fraud detection on transactions and claims.
- Capacity and staffing forecasts for clinics, hospitals, and labs.
- Supply usage prediction for critical drugs, devices, and high-cost services.
These examples focus on operations and planning, not clinical diagnosis or treatment. For any health-related decision, clinical judgement and regulatory guidelines always lead.
Cross-industry quick wins
- Churn models that flag customers likely to leave in the next 30–90 days.
- Sales opportunity scoring to help account managers prioritize outreach.
- Cash-flow prediction based on historical payment patterns.
If you manage recurring revenue, field assets, or large inventories, there is likely at least one predictive use case that can show value within a single quarter.
Mini case: turning drilling data into proactive decisions
In one engagement, Cadeon helped an innovative drilling contractor automate high-frequency rig instrumentation data integration and deliver interactive Spotfire dashboards across the organization. Engineers and leaders moved from manual daily reports to near real-time performance views, spotting emerging issues on specific wells and prioritizing interventions before small problems became expensive downtime. Read the full case study.
Getting started with predictive analytics
Many leaders feel “behind” on advanced analytics, even though they sit on mountains of data. The fastest way forward is a focused, business-led approach that treats early predictive projects as experiments to de-risk bigger investments.

- Pick one sharp question. For example: “How do we cut unplanned downtime by 10%?” or “Which customers deserve proactive outreach this month?”
- Check your data foundations. You need accessible, trustworthy data more than exotic algorithms. Many clients start by modernizing reporting with Spotfire dashboards and data pipeline & integration.
- Start with a proof of value. A small, well-scoped predictive model in one area can demonstrate benefits and help fund the next wave of work.
- Put the model where people work. Integrate predictions into existing dashboards, workflows, and tools instead of asking users to log into yet another system.
- Build capability, not just code. Upskill analysts and domain experts so they understand what the model is saying, when to trust it, and when to challenge it.
Once you have a small win, you can repeat the Q–D–M–A cycle in adjacent areas, gradually building a shared analytics language across IT, business, and operations.
Common pitfalls to avoid
- Overfitting and stale models. Models that perfectly explain last year’s data but are not validated on new data create false confidence. Track performance and refresh models as behaviour, equipment, or markets shift.
- Poor data quality and silos. Missing, inconsistent, or duplicated records undermine trust in predictions. Invest early in data quality and integration so users are not fighting the data.
- Insights that never reach the front line. If scores live in a separate tool that frontline teams rarely open instead of being embedded into existing dashboards and planning workflows, nothing changes.
Cadeon’s structured Synapses framework and our $10K Digital Transformation Challenge are designed to prove measurable value from data in weeks, not years, while setting you up with a governed analytics foundation.
Ready to explore where predictive analytics fits in your roadmap? Book a free consult with our team to discuss your data landscape and priority use cases.
Predictive analytics FAQ
Is predictive analytics the same as machine learning?
Not exactly. Predictive analytics is the business practice of using data and models to estimate future outcomes and support decisions, while machine learning is a set of algorithms often used to build those models. You can also use traditional statistics for predictive work and machine learning for tasks, like image recognition, that are not primarily predictive.
Do we need a large in-house data science team to benefit?
Usually not. Many organizations start with a small internal group (business lead, analyst, IT owner) and work alongside experienced external advisors. With the right data platform and visual tools, you can move from descriptive to predictive insight while your team builds skills on real projects.
What data do you need for predictive analytics?
You generally need a clear outcome to predict (such as unplanned downtime or customer churn), a history of that outcome over time, and related input data like sensor readings, transactions, or customer interactions. You don’t need a perfect dataset, but you do need enough historical examples and a governed way to connect the key data sources.
What are the biggest challenges when implementing predictive analytics?
The biggest hurdles are usually organizational, not technical. Aligning on a sharp business question, getting access to clean, trustworthy data across silos, and changing day-to-day decisions so people actually use the new insights are all critical. Successful teams also invest in data literacy, clear ownership for models, and a regular cadence for monitoring and refreshing them as conditions change.
Key takeaways
- Start with one high-value question, the minimum trusted data needed, and a small proof of value rather than a large, unfocused analytics program.
- Embed the right models into everyday tools and workflows, invest early in data quality and governance, and treat predictive analytics as an ongoing lifecycle you monitor and refine.
Ready to transform your data strategy?
You might also like
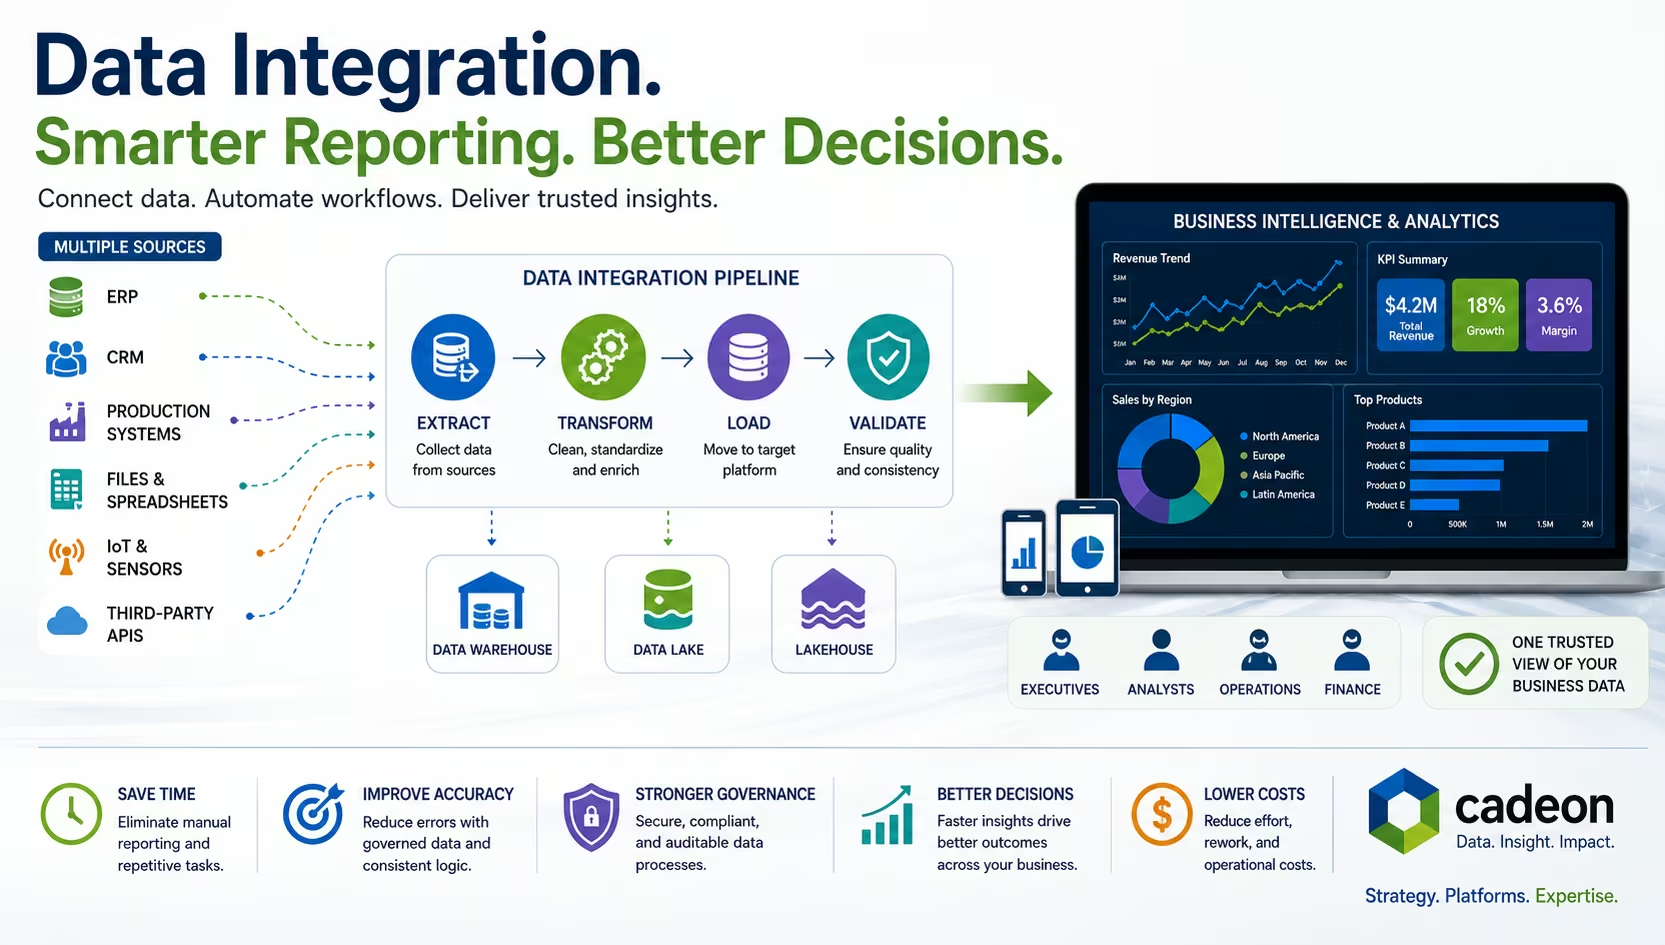
What Is Data Integration? Methods, Tools, and BI Explained
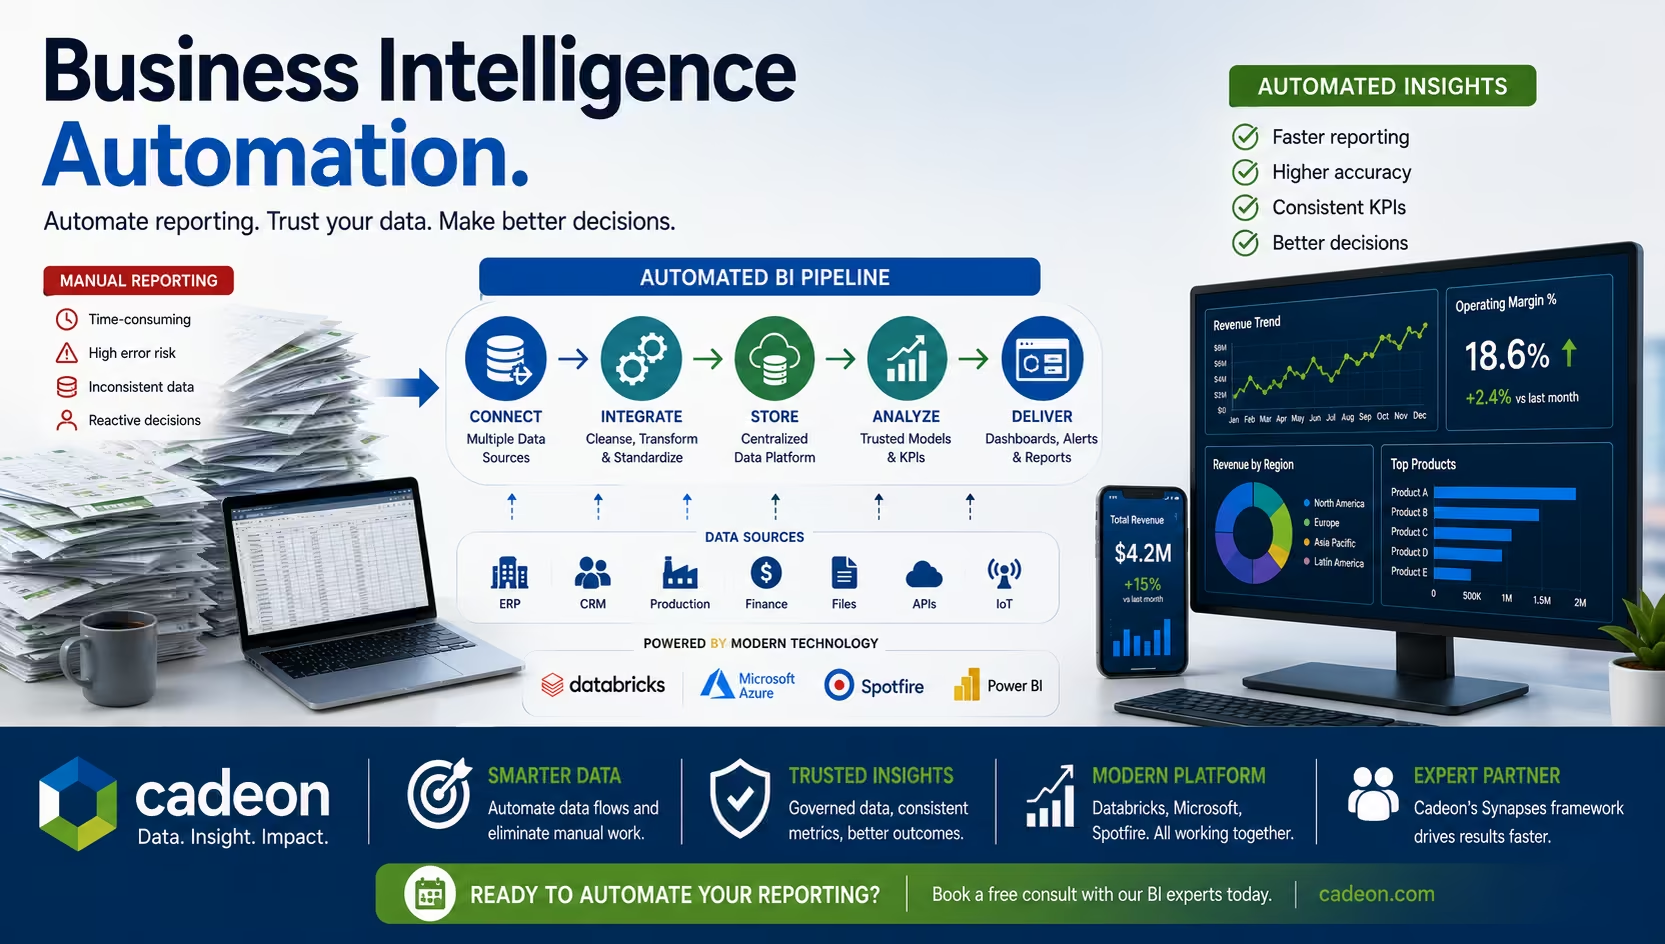
Business Intelligence Automation for Faster Reporting & Insights