Data-Driven Culture: How to Build It in Your Organization

Think about the last big decision your leadership team made. Was it based on a dashboard everyone trusted, or on whoever spoke the loudest in the room? Many organizations say they want to be “data-driven”, yet day-to-day choices still hinge on gut feel, spreadsheets emailed at midnight, and debates about whose numbers are right.
Building a genuine data-driven culture means people at every level know where to find reliable information, feel confident using it, and trust that leaders will back decisions grounded in facts, not hunches. You don’t need a huge team or a massive budget to get there.
This guide walks through practical steps you can start this quarter.
TL;DR
- A strong data-driven culture rests on mindset, skillset, and toolset in that order.
- Start by defining a few business outcomes, then align leadership behaviours, metrics, and incentives.
- Invest in data literacy and simple, governed analytics tools rather than one-off reports.
- Use a focused pilot (for example, a $10K proof-of-value project) to prove success and scale.
Table of Contents
- What is a data-driven culture?
- Why a data-driven culture matters now
- Common barriers that keep teams stuck
- How to create a data-driven culture: 7 practical steps
- Choosing software for data-driven culture initiatives
- Start small: design a low-risk pilot
- How Cadeon can help
What is a data-driven culture?
In simple terms, a data-driven culture is a way of working where data is part of every meaningful decision from the boardroom to the frontline. People don’t just glance at reports; they ask better questions, challenge assumptions, and use shared numbers as the basis for action.
Three elements show up again and again in organizations that do this well:
- Mindset: Leaders and teams believe that better data leads to better outcomes.
- Skillset: Employees can interpret charts, spot trends, and understand basic concepts like variance and correlation.
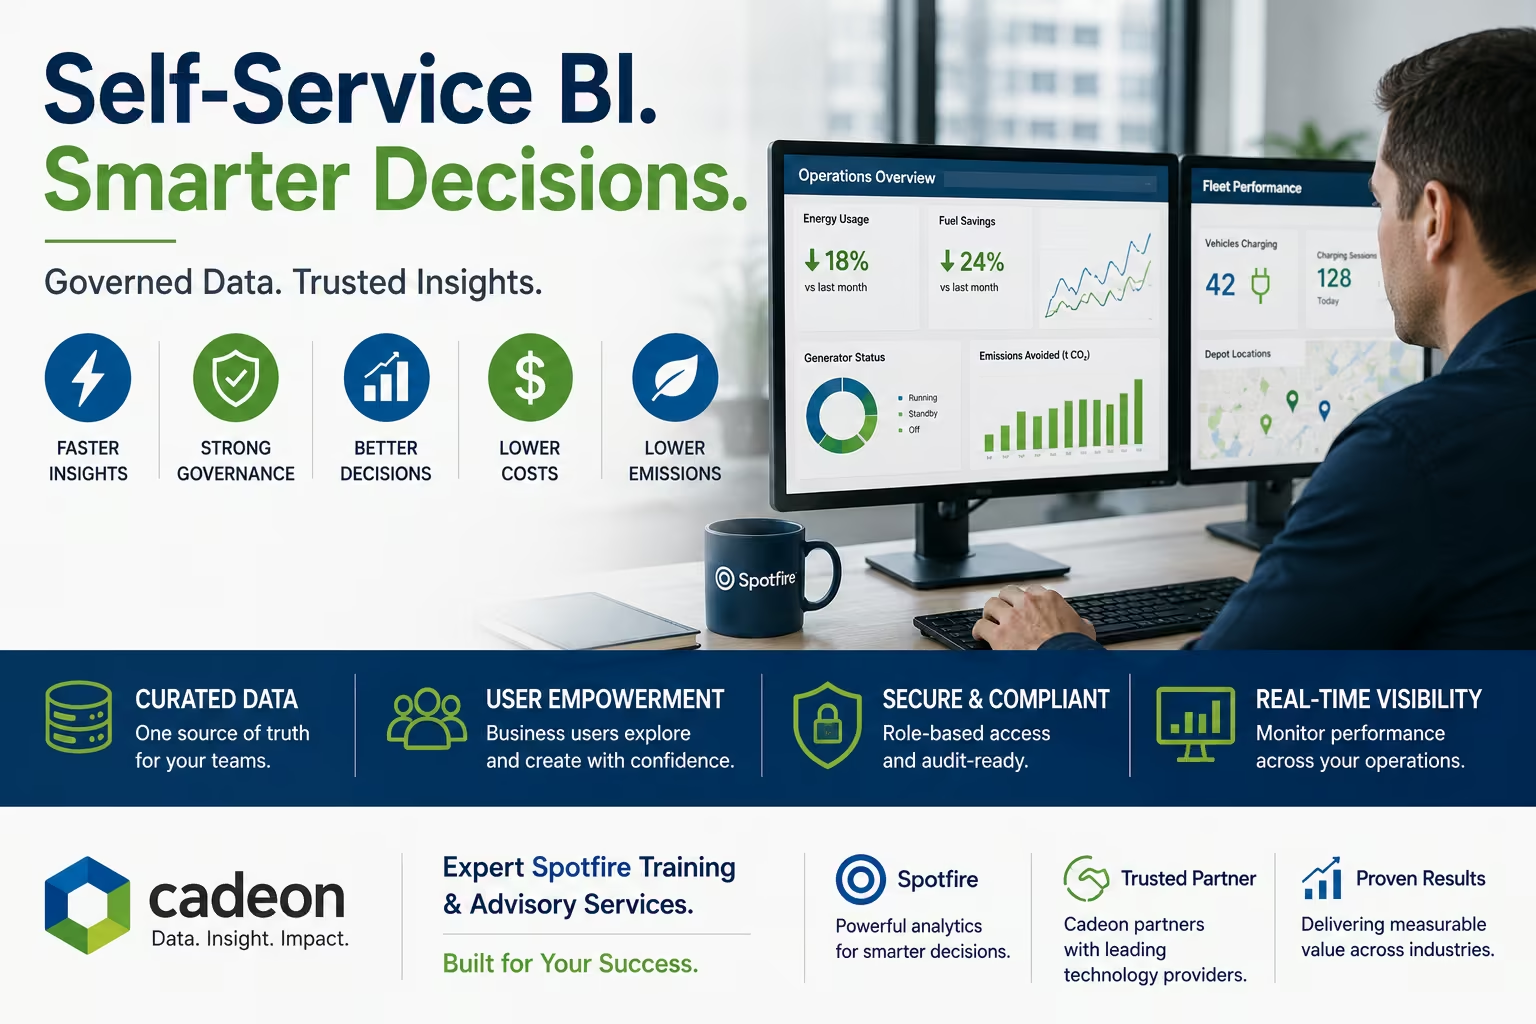
- Toolset: There is a governed analytics platform (for example, Spotfire) that makes insights accessible, consistent, and fast.

From mindset to toolset
Mindset → Skillset → Toolset
You first set expectations (“we decide with data”), then build skills through training and coaching, and only then scale platforms and dashboards. Many failed initiatives reverse this order and over-invest in tools before people are ready to use them.
Without all three, “data-driven” becomes a slogan on a slide rather than a habit in daily operations.
Why a data-driven culture matters now
For mid-sized and large organizations, especially in energy, utilities, manufacturing, and financial services, data volume has exploded: sensor data, production logs, ERP systems, and CRM platforms generate more information than ever, yet the real gap is turning it into shared insight people trust.
Research from sources such as Harvard Business Review and MIT Sloan shows that organizations that embed analytics into decision-making are consistently more productive and more profitable than their peers.
- Executives regularly ask, “What do the numbers say?” before approving major decisions.
- Operations teams can compare performance across assets, plants, or regions using shared metrics.
- Finance, operations, and IT work from the same definitions and data sets.
Common barriers that keep teams stuck
If you feel your organization is “drowning in data but starved for insight,” you’re not alone. In our work with clients across Canada and the US, a few patterns show up repeatedly.
- Fragmented data and tools. Different business units keep their own spreadsheets and definitions and use overlapping BI tools, so numbers conflict, work is duplicated, and no one is sure where the “single source of truth” lives especially before a modern data virtualization layer is in place.
- Manual, slow processes. Analysts spend most of their time exporting, cleaning, and emailing reports instead of exploring trends and spotting risks, leaving little capacity for higher-value analysis.
- Low trust in the data. When numbers don’t match or reports arrive late, people fall back to gut feel or “the way we’ve always done it.”
- Limited data literacy. Not everyone is comfortable reading charts or understanding statistical noise, especially in asset-heavy environments with volatile signals.
Culture shifts when data becomes simpler, faster, and safer to use than the old way of making decisions.
The rest of this article focuses on how to shift those patterns step by step.
How to create a data-driven culture: 7 practical steps
Culture change rarely comes from a big-bang program. It comes from many small, consistent moves that send the same message: “We make decisions with data here.”
Step 1: Start with 2–3 business outcomes, not with tools
Before you think about dashboards, clarify where data can move the needle. Maybe it’s improving asset uptime by 3%, cutting reporting time in half, or shortening the monthly close. Write those outcomes down and socialize them with your leadership team.
This short list becomes your north star when evaluating initiatives and data and analytics investments.
Step 2: Make leadership behaviours match the slideware
People believe what leaders do more than what leaders say. If executives ask for data in meetings, challenge untested assumptions, and are transparent about the metrics guiding decisions, teams quickly learn that numbers matter.
A simple practice: for every major decision memo, ask for one page of narrative and one page of visuals or metrics that back the recommendation.
Step 3: Create a common language for metrics
One of the fastest ways to build confidence is to standardize key definitions: production efficiency, downtime, netback, customer churn, and so on. Document them in a shared glossary and connect those definitions to governed data models inside your BI platform.
When the CFO and plant manager are truly looking at the same metric, tough conversations become much easier. If you need a starting point, you can review a short overview of data-driven culture best practices and adapt the KPI and governance examples to your context.
Step 4: Invest in data literacy for non-analysts
A lot of “resistance to data” is actually discomfort. Many frontline supervisors and business managers have never been shown how to read box plots, interpret control charts, or question the way a visual is built.
Short, role-based workshops for example, customized Spotfire training for engineers or finance analysts pay for themselves quickly. The goal isn’t to turn everyone into a data scientist; it’s to help them ask sharper questions.
Step 5: Put governance around self-service analytics

Self-service BI can be a blessing or a headache. Without governance, you end up with “dashboard anarchy.” With a clear centre of excellence, data catalog, and publishing standards, you get the best of both worlds: speed and trust.
- Define who can create official dashboards vs. exploratory ones.
- Set up shared data sources instead of copying extracts into personal files.
- Document which reports are used for regulatory, financial, or board reporting.
Step 6: Align incentives and performance conversations
If bonuses and promotions ignore data-backed performance, culture will too. Build agreed metrics into scorecards and one-on-ones. Celebrate teams that experiment, learn from the numbers, and share what worked.
This doesn’t mean chasing every blip on a graph; it means tying rewards to thoughtful, evidence-based decisions.
Step 7: Measure and communicate impact
Focus measurement on a short list of KPIs tied to your original outcomes for example, report cycle time, unplanned downtime on critical assets, or forecast accuracy for production, demand, or revenue plus one or two adoption metrics such as active dashboard users or the percentage of meetings that open with shared data.
Capture a baseline before you launch, then review these measures with stakeholders on a simple quarterly cadence: what changed, why, and what to adjust. Best-practice organizations use this kind of review cycle to keep analytics programs aligned to business value, not just technology milestones; this guidance on building a data-driven culture offers a useful checklist.
As you iterate, close the feedback loop with users and act on what you hear. Small improvements to labels, filters, and refresh times reinforce that analytics is a living product, not a one-off IT project, and help turn early enthusiasm into lasting habits.
Choosing software for data-driven culture initiatives
Many leaders quietly wonder: “Do we have the right software for data-driven culture, or are we just adding another tool to the pile?” The answer depends less on brand names and more on how the platform supports your people and processes.
Key capabilities to look for
- Unified view of data: Can you bring together operational, financial, and external data without constant manual stitching?
- Interactive visual analytics: Can business users easily slice, drill, and compare, rather than waiting on static PDF reports?
- Security and governance: Can you control access by role, region, or asset, while maintaining a single source of truth?
- Performance at scale: Does the platform handle high-volume, time-series, or geospatial data, common in energy and asset-intensive industries?
How to shortlist and pilot tools
Instead of running a long RFP with a dozen vendors, pick one or two platforms that fit your architecture and run tightly scoped pilots. Define four or five evaluation criteria for example, ease of use for business users, integration with your existing data sources, governance and security features, performance on your largest datasets, and total cost of ownership. Score each candidate against the same list so discussions stay grounded.
Make sure business stakeholders are in the room for demos and pilot working sessions. Let engineers, analysts, and frontline users try building the kind of dashboards or analyses they actually need, not just canned sales examples. Capture their feedback on what felt fast, what felt confusing, and which tool they would realistically adopt. A platform that looks good in a slide deck but fails this “day-in-the-life” test is unlikely to support a sustainable data-driven culture.
Technologies like Spotfire, Microsoft Power BI, and modern data virtualization layers can support all of this when implemented with a clear architecture and training plan. The software should make it simple for your domain experts, engineers, controllers, planners to explore reliable numbers without waiting weeks for a new report.
External resources such as the Gartner Magic Quadrant for Analytics and Business Intelligence Platforms or industry-specific benchmarks can be helpful reference points when you’re evaluating vendors and features.
Start small: design a low-risk pilot

Rather than trying to “fix data” across the entire enterprise, pick one use case where you can prove value quickly. For example:
- Reducing unplanned downtime on a critical asset line.
- Improving production forecasting accuracy for a key region.
- Shortening the month-end reporting cycle for a specific business unit.
A typical pilot pattern
In many energy and utilities pilots, operations, maintenance, and finance teams start with separate spreadsheets and conflicting views of asset performance. A fixed-fee proof-of-value project often around $10K focuses everyone on a single use case, such as loss management or month-end reporting for one business unit, and uses a modern data virtualization layer plus governed Spotfire dashboards on top of existing systems.
Mini case study: A Western Canadian pipeline operator used this pattern to virtualize key operational and financial data and surface it in Spotfire. In eight weeks, they cut month-end reporting time by about 40% and reduced manual spreadsheet work by more than half, giving operations and finance a single, trusted view of asset performance.
To design your own pilot, define success metrics up front, assemble a cross-functional team (business, IT, and an analytics partner), and commit to a short, time-boxed project. At Cadeon, we often structure this as a $10K Digital Transformation Challenge so leaders see tangible results and a concrete internal case study before scaling up.
How Cadeon can help build your data-driven culture
Building this kind of culture is hard to do from the inside alone, especially when teams are already stretched. An experienced partner can bring tested architectures, accelerators, and training approaches so you don’t have to learn everything the long way.
Across recent client engagements, these approaches have translated into measurable results for example, reporting and decision-making that run up to 50% faster and manual data processing reduced by about 60%, consistent with the outcomes highlighted on our homepage. You can see our case studies.
Cadeon has helped organizations across energy, utilities, manufacturing, and financial services:
- Modernize legacy reporting into interactive Spotfire dashboards.
- Stand up governed analytics platforms using data virtualization.
- Run focused pilots that uncover quick wins and build momentum.
- Design and deliver customized training that lifts data literacy across teams.
If you’d like to explore what this could look like in your organization, you can book a free consultation with our team. We’ll talk through your current data landscape, the outcomes you care about most, and practical first steps for the next 90 days.
This article was created with the assistance of AI and reviewed by Cadeon’s data and analytics experts for accuracy and clarity.
About the author
The Cadeon Data & Analytics Team, alongside its partners, has spent nearly two decades helping organizations turn information into money, blending architecture, visualization, and training as a Spotfire value-added reseller and data advisory partner to help leaders make faster, more confident decisions.
Learn more about our services or explore additional insights on the Cadeon blog.
Ready to transform your data strategy?
You might also like
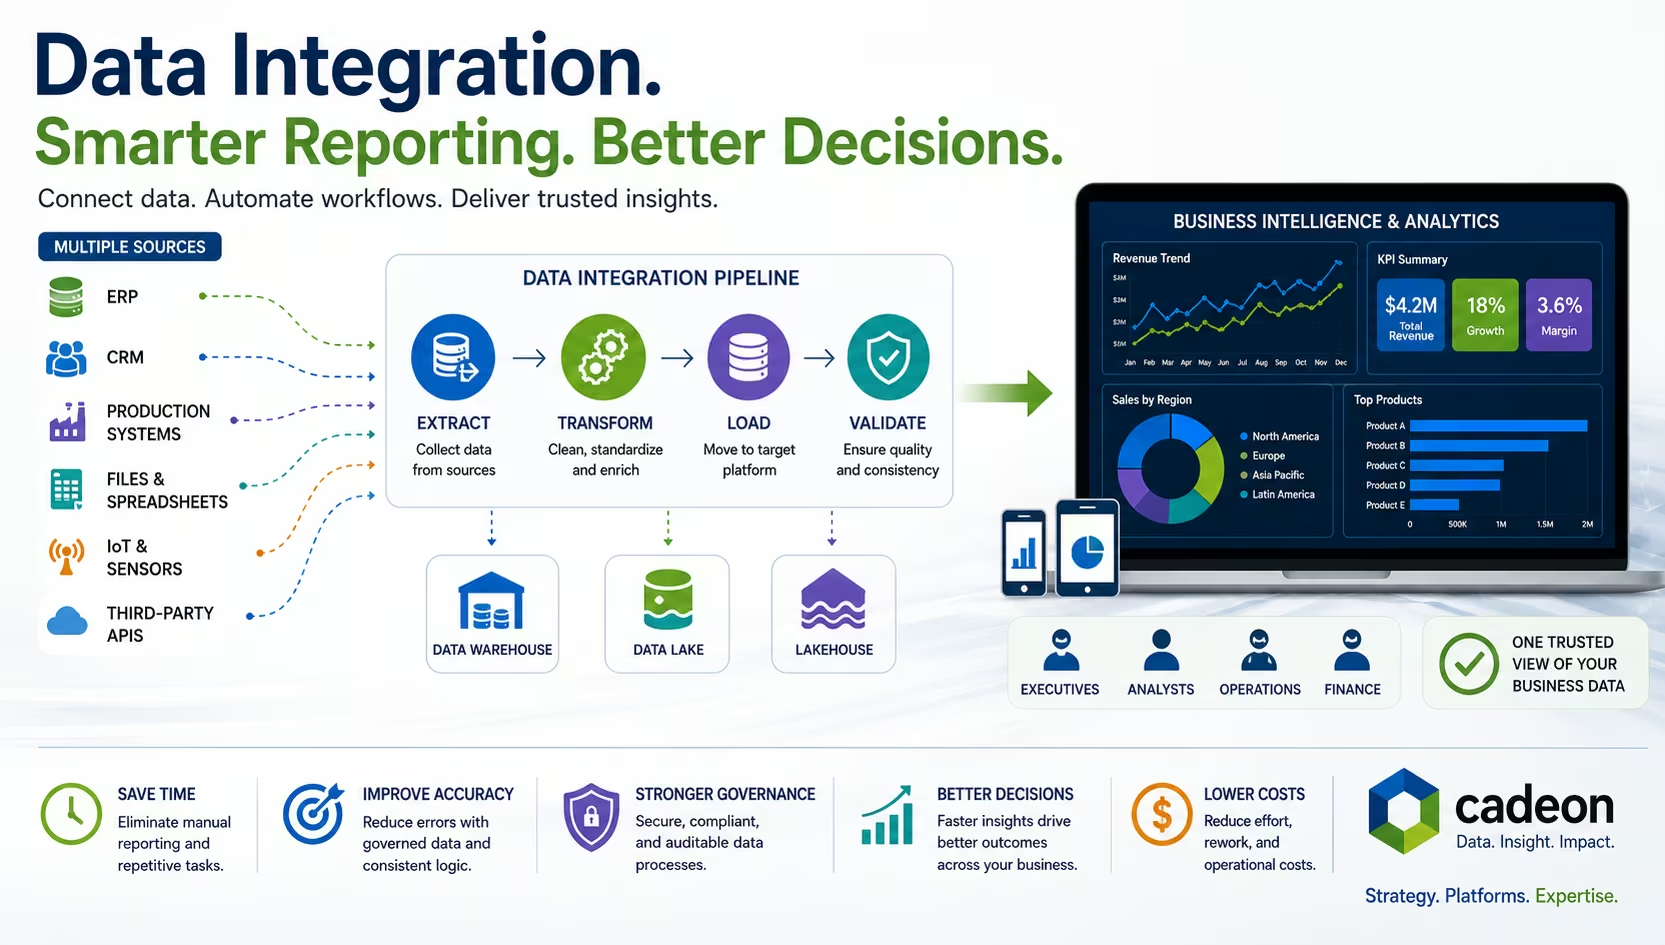
What Is Data Integration? Methods, Tools, and BI Explained
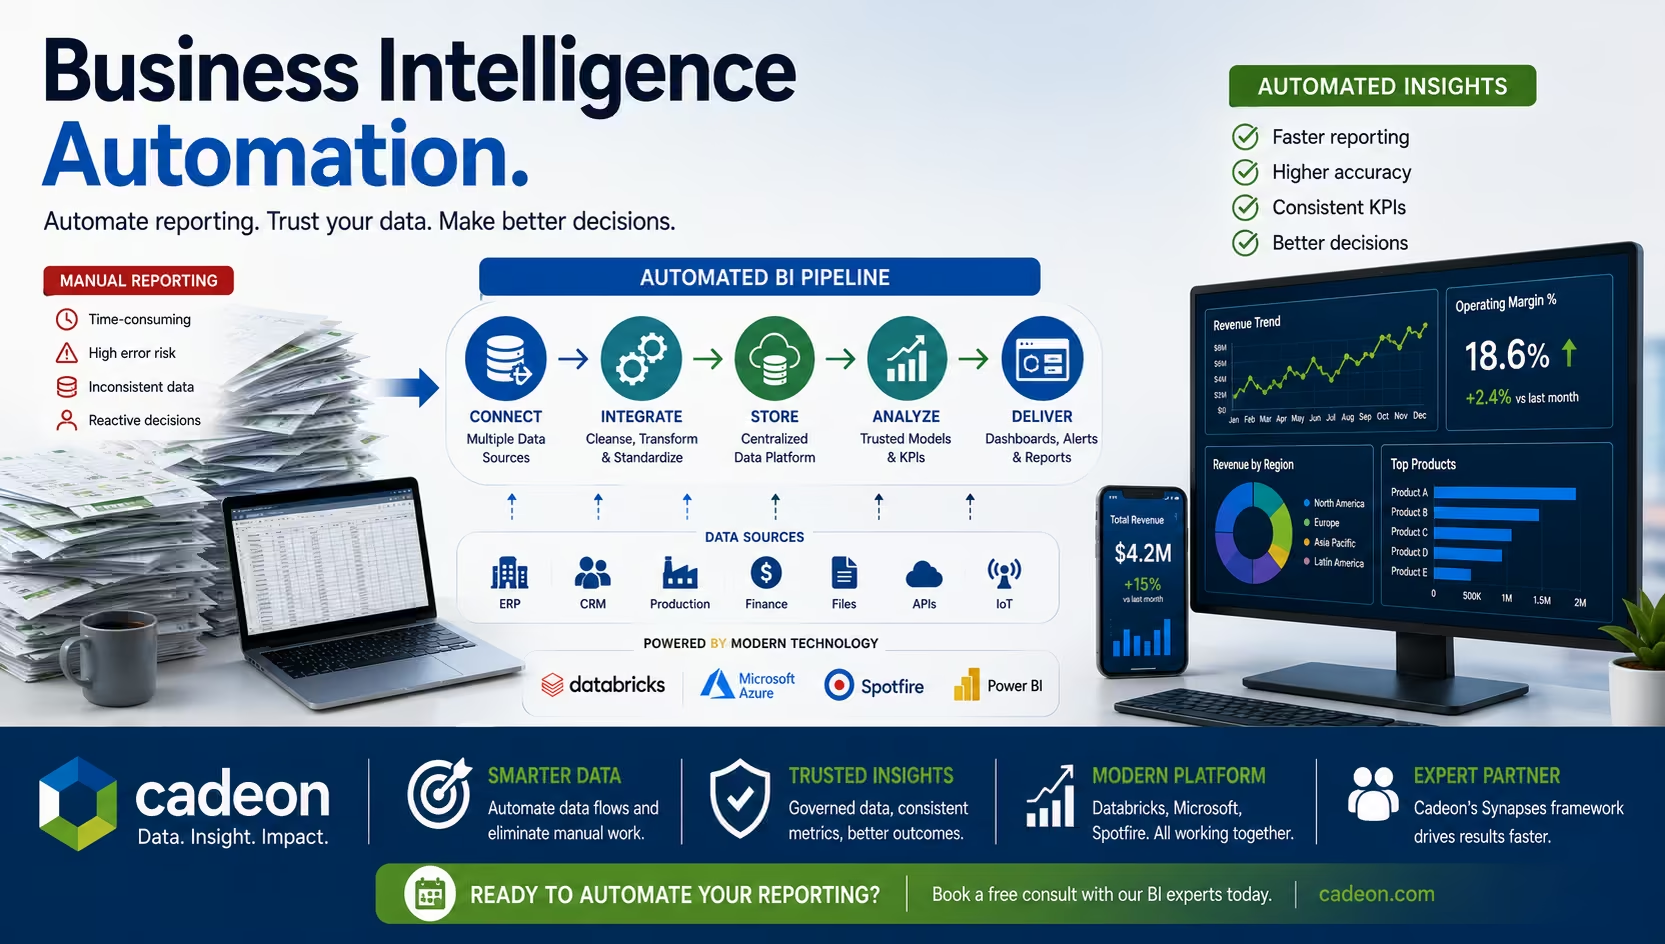
Business Intelligence Automation for Faster Reporting & Insights