Data Science vs. Data Analytics: Which Path for Your Business?

A modern analytics team reviewing both dashboards and advanced models, reflecting the blend of data science and data analytics.
TL;DR
- Short version: Think of data analytics as understanding what happened and why, and data science as building models to predict what will happen next or simulate what could happen.
- If your reports are slow, manual, or inconsistent, analytics will usually give you faster wins.
- If your data is already clean, centralized, and heavily used, data science can add predictive and prescriptive power.
- Most organizations see the best results by solidifying analytics first, then layering targeted data science projects on top.
Table of Contents
- What Is Data Analytics?
- What Is Data Science?
- Data Analytics vs Data Science: Key Differences
- Which One Does Your Business Need First?
- Skills, Tools, and Team Structures
- How Cadeon Blends Analytics and Data Science
- Choosing Your Path: Leaders and Practitioners
- FAQ: Data Science vs Data Analytics
If you’re comparing data science vs data analytics, you’re likely hearing mixed messages: “Hire a data scientist,” “Start with BI,” “Move to AI,” and so on. Meanwhile, your teams still fight spreadsheets every month-end, and leaders just want clear answers they can trust.
In conversations with CIOs, VPs of Operations, and analytics managers across industries, one theme repeats: job titles are confusing, but business problems are not. You need better decisions, faster, so let’s clarify what each discipline does and where to invest next.
What Is Data Analytics?
Plain‑English definition
Data analytics is the practice of using existing data to answer questions about business performance. It focuses on describing what happened and diagnosing why it happened, usually through dashboards, reports, and ad hoc analysis.
A data analyst might:
- Pull data from systems using SQL or data virtualization tools
- Build dashboards in platforms like Spotfire, Power BI, or similar BI tools
- Monitor KPIs such as production efficiency, revenue per customer, or downtime
- Slice results by region, product line, or asset to explain trends

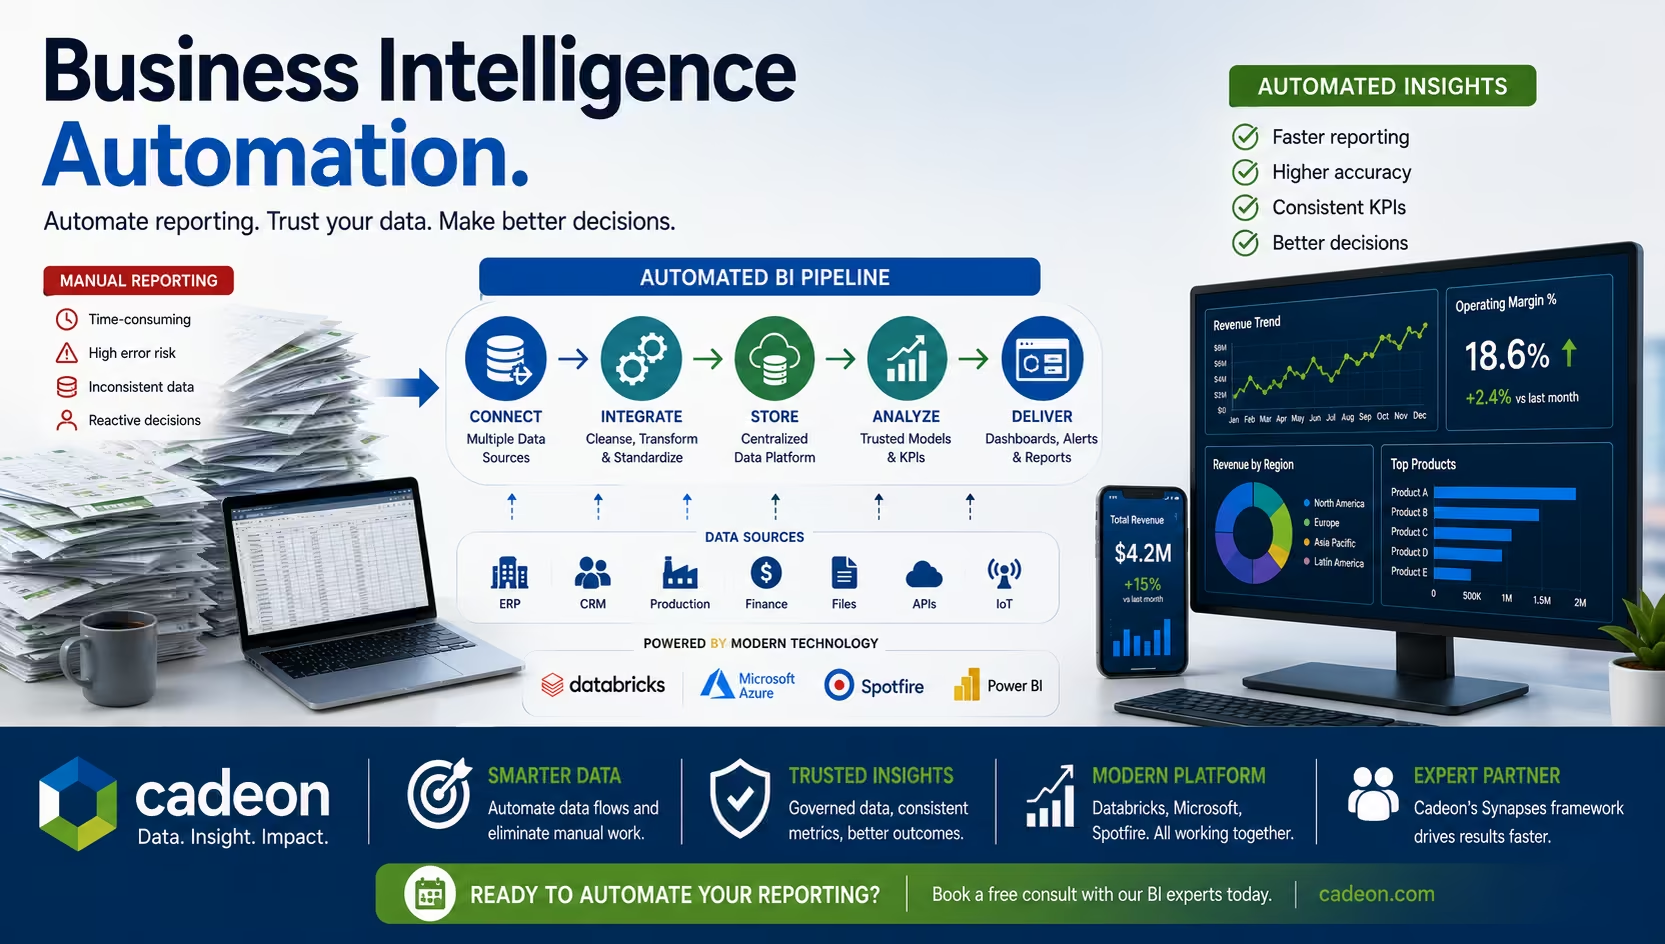
Data analytics focuses on practical BI dashboards and KPI reporting to explain what happened and why.
At Cadeon, much of our data consulting and implementation work lives in this world: making sure teams have trusted, consistent numbers they can use every day.
Common business use cases for analytics
- Operational dashboards for drilling, production, or logistics performance
- Financial reporting and variance analysis
- Customer and sales performance tracking
- Regulatory and compliance reporting
- Loss management and downtime analysis
Research from MIT Sloan shows that organizations that use analytics effectively are far more likely to outperform peers; one large study across 120 companies found that “transformed” organizations were more than three times as likely to substantially outperform their industry peers. (MIT Sloan analytics study; Cadeon Spotfire analytics guide)
What Is Data Science?
Plain‑English definition
Data science goes a step further. It uses statistics, machine learning, and programming (often Python or R) to build models that predict future outcomes or simulate scenarios.
A data scientist might:
- Train a model that forecasts equipment failure based on sensor data
- Estimate customer churn risk for each account
- Optimize pricing or inventory with scenario modeling
- Work with engineers to productionize models into apps or dashboards

Data science applies advanced models and machine learning to predict outcomes and test scenarios.
When data science shines
Data science pays off when:
- You have large, reasonably clean historical datasets
- There’s a clear, well‑defined outcome (e.g., failure / no failure, churn / no churn)
- Small improvements have big dollar impact (fuel usage, downtime, safety, fraud, etc.)
Studies from firms such as McKinsey show that data‑driven organizations are more likely to acquire and retain customers and be profitable than their peers when analytics and data science are applied to real business decisions. (Microsoft data-driven insights article)
Data Analytics vs Data Science: Key Differences
You’ll hear people argue data analytics vs data science as if you must pick a single winner. In practice, they solve different layers of the same problem.
Side‑by‑side comparison
Short rule of thumb: analytics focuses on understanding performance, while data science focuses on predicting and optimizing it.
Analytics vs Data Science: Quick 2×2 View
Another way to frame the choice is by looking at your data maturity and the type of questions you’re trying to answer:
In a healthy analytics program, these functions reinforce each other: analysts watch core metrics while data scientists tackle targeted problems where prediction has clear payback. Industry surveys such as the NewVantage data and AI survey still find that only a minority of large organizations describe themselves as truly data‑driven, which is why getting the analytics basics right matters so much.
Which One Does Your Business Need First?
Signs you need stronger analytics
If any of these sound familiar, analytics should be your first priority:
- Leaders argue over “whose numbers are right” in every meeting
- Most reporting lives in spreadsheets that break whenever someone leaves
- There’s no single, governed source of truth for core KPIs
- It takes days or weeks to answer basic “what happened?” questions
In this situation, building out governed dashboards and data models in platforms like Spotfire and related analytics solutions will usually beat a flashy data science pilot on both speed and impact.
Signs you’re ready for more data science
On the other hand, you may be ready to grow beyond descriptive analytics if:
- Your KPIs are trusted and heavily used across the business
- You already have centralized, well‑modeled data (often in a warehouse or data lake)
- Teams are asking “what will happen if…?” and “how do we optimize this?”
- You have clear problems where prediction directly supports decisions
For example, an energy company with strong operational dashboards might work with a data scientist to predict production losses based on sensor data, then conduct rigorous Spotfire testing to surface those predictions back inside dashboards for field teams.
Skills, Tools, and Team Structures
Core skills for analytics vs data science
From a people perspective, analytics vs data science often hinges on emphasis:
- Data analysts lean toward business process knowledge, SQL, data modeling, and visualization.
- Data scientists lean toward probability, statistics, feature engineering, and model evaluation.
Many organizations also benefit from “analytics engineers” or “BI developers” who build the semantic layer and governed models that both analysts and data scientists rely on.
Popular tools and platforms
A modern analytics stack typically combines:
- Data integration and virtualization to bring sources together
- BI and visualization tools like Spotfire with structured training for day‑to‑day decision‑makers
- Notebook environments (Jupyter, Databricks, etc.) for data science experiments
- Governance and security to keep data trusted and compliant
External surveys regularly show that companies combining strong analytics foundations with advanced techniques see higher odds of customer growth and profitability than those treating analytics as isolated experiments.
If your current setup feels fragmented, starting with a clear data strategy and implementation plan can save years of rework later.
How Cadeon Blends Analytics and Data Science
At Cadeon, we rarely recommend jumping straight into ambitious AI projects without first shoring up the basics. Over the years working with hundreds of businesses, a simple pattern holds up well:
The Cadeon Analytics-to-AI Ladder
We capture this journey in a simple four-step framework we call the Cadeon Analytics-to-AI Ladder:

The Analytics-to-AI Ladder illustrates how organizations progress from basic reporting to advanced data science.
- Stabilize your data foundation (integration, quality, governance).
- Deliver visible analytics wins with self‑service, governed dashboards.
- Identify focused data science use cases with clear business ownership.
- Surface model results inside existing analytics workflows so people can actually use them.
Mini case: In one energy project, drilling and completions teams were manually exporting and aggregating daily operational data from multiple systems before each stand‑up. Cadeon implemented a Spotfire-based operational dashboard alongside targeted spotfire training, helping teams automate data integration, apply consistent business rules, and confidently use a single shared view of key KPIs, dramatically reducing reporting effort. You can read the full case study in our Resource Hub: Operational dashboards in energy.
That’s why our Synapses™ framework and $10K proof‑of‑value challenges focus on practical outcomes: faster reporting, better visibility, and then advanced analytics once the basics are solid.
If you want to see how this plays out in real organizations, explore the case studies and webinars in our Resource Hub, including examples that combine Spotfire analytics with machine learning on platforms like Databricks. (Cadeon website)
Choosing Your Path: Leaders and Practitioners
For business and technology leaders
If you lead a business unit, IT, or analytics team, frame the analytics vs data science conversation in terms of a few key decisions:
- Which important decisions rely on stale, manual, or disputed data?
- Where would better prediction, not just better reporting, change outcomes?
- Where would a 1–2% improvement in accuracy or uptime pay for an entire project?
Once you have those answers, map them to capabilities such as reporting, diagnostics, forecasting, and optimization. That makes it easier to decide whether to expand BI, bring in data science, or both.
For analysts and aspiring data professionals
For your own career, the choice often comes down to what you enjoy most:
- Analytics: business conversations, domain knowledge, and explaining charts.
- Data science: coding, statistics, and experimentation.
Either path benefits from a strong base in SQL, data modeling, and communication so you can work effectively with both groups.
Demand for these skills continues to grow: the U.S. Bureau of Labor Statistics projects 34% employment growth for data scientists from 2024 to 2034, much faster than average across all occupations. (BLS data scientist outlook)
Many data scientists start in analyst or BI roles and later add programming and statistical skills, becoming bridges between business and advanced modeling.
Key Takeaways
- Analytics and data science play different roles. You likely need both over time, but not at the same pace.
- Start where the pain is. If reports are slow and messy, strengthen analytics before funding AI projects.
- Think in decisions, not job titles. Map real decisions to the capabilities you need.
- Build for everyday use. The best data science work shows up inside tools your teams already use, such as governed dashboards.
If you’d like help sorting out where to invest next, you can always book a free consult to talk through your current analytics landscape and goals.
FAQ: Data Science vs Data Analytics
How do I know if a data science project is worth it?
A quick test:
- Can you state the decision that the model will support in one sentence?
- Can you estimate, even roughly, the financial impact of making that decision better or faster?
- Do you have enough historical data, and is someone accountable for using the output?
If you can’t answer those questions, you may be better off strengthening analytics first.
Do I need both analytics and data science teams?
Not right away. Many companies start with a small analytics team or a trusted partner and later add data science expertise for specific use cases. Some mid-sized organizations work with Cadeon’s partners instead of building large in-house teams from day one, giving them access to proven expertise without the overhead.
Which is better for business data analytics: data science or data analytics?
For most organizations, data analytics delivers faster, more visible improvements at first: standard KPIs, self‑service dashboards, and reliable reporting. Data science becomes powerful once that foundation is in place and you have clear, focused problems where prediction or optimization will pay off.
Is data science just "advanced" data analytics?
Not exactly. Data analytics focuses on summarizing and explaining existing data. Data science uses more advanced methods to build models that predict or simulate. In practice, one is not a simple senior version of the other; they are complementary disciplines.
Ready to transform your data strategy?
You might also like
.png)
AI As a Paradigm Shift
Here’s something our team has been talking about. If your organization is investing in AI—pilots, platforms, use cases—but somehow the results still feel incremental instead of transformative, then keep reading.
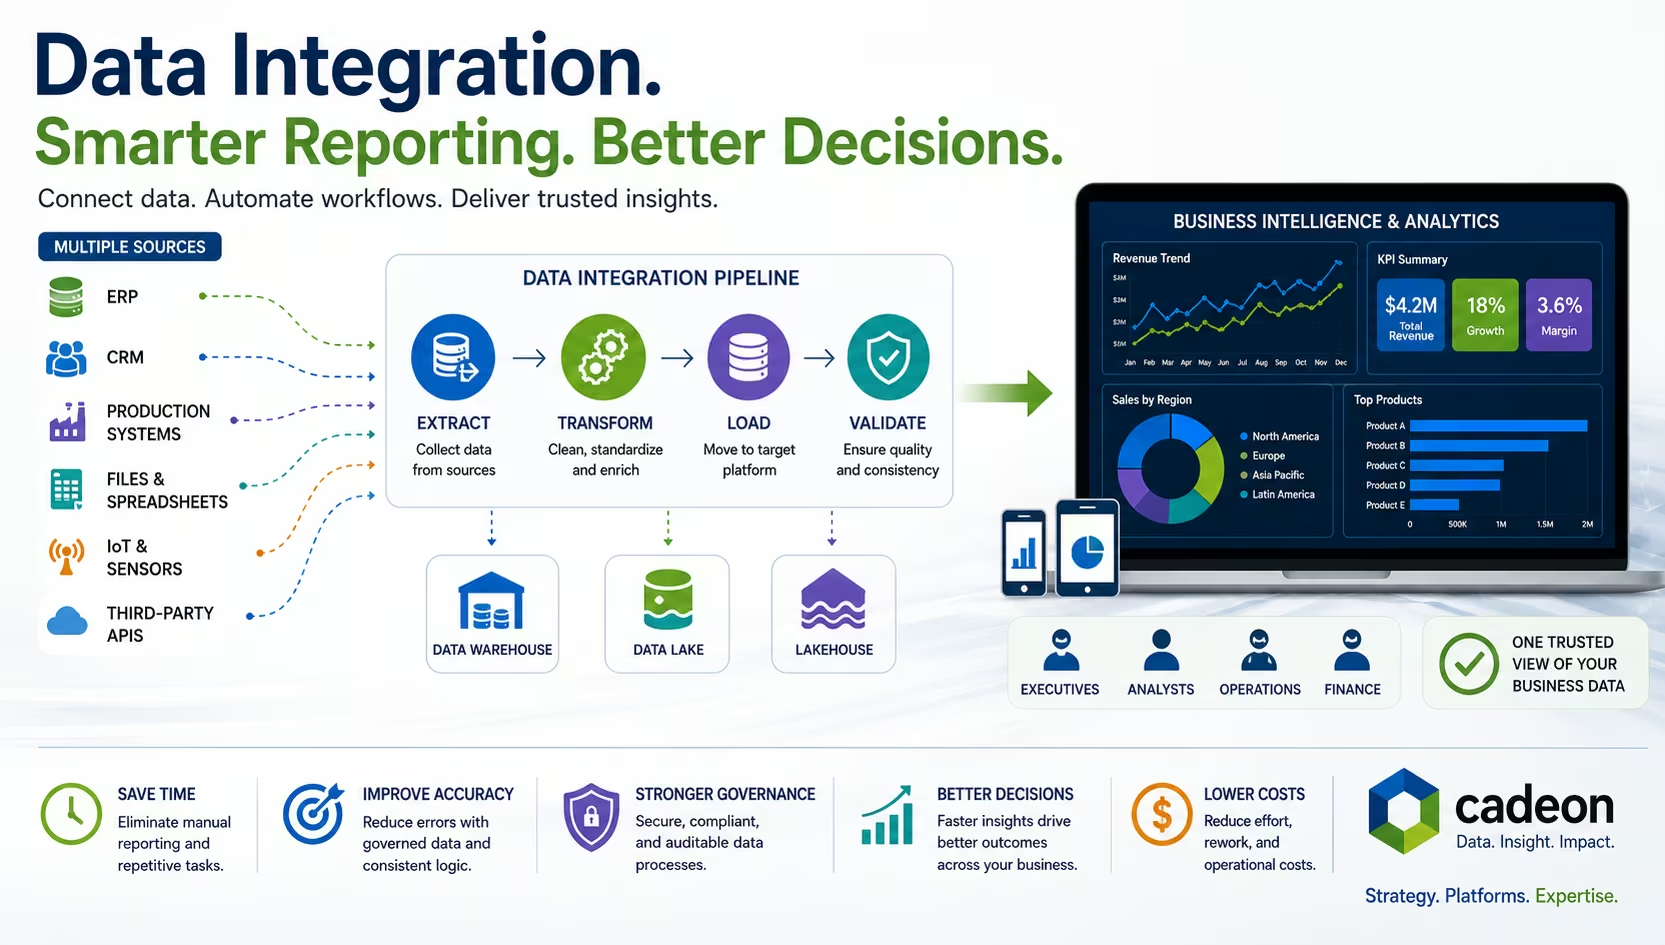
What Is Data Integration? Methods, Tools, and BI Explained