Data Warehouse Design & Analytics Guide | Architecture & Benefits
TL;DR
- A data warehouse is a central, trusted store of historical, integrated data used for reporting and analytics.
- Good data warehouse architecture separates raw data, clean business logic, and analytics-ready views.
- Strong data warehouse design supports dashboards, regulatory reporting, self-service analytics, and data science.
- Most mid-sized organizations feel the need for a warehouse when manual reports keep breaking or contradicting each other.
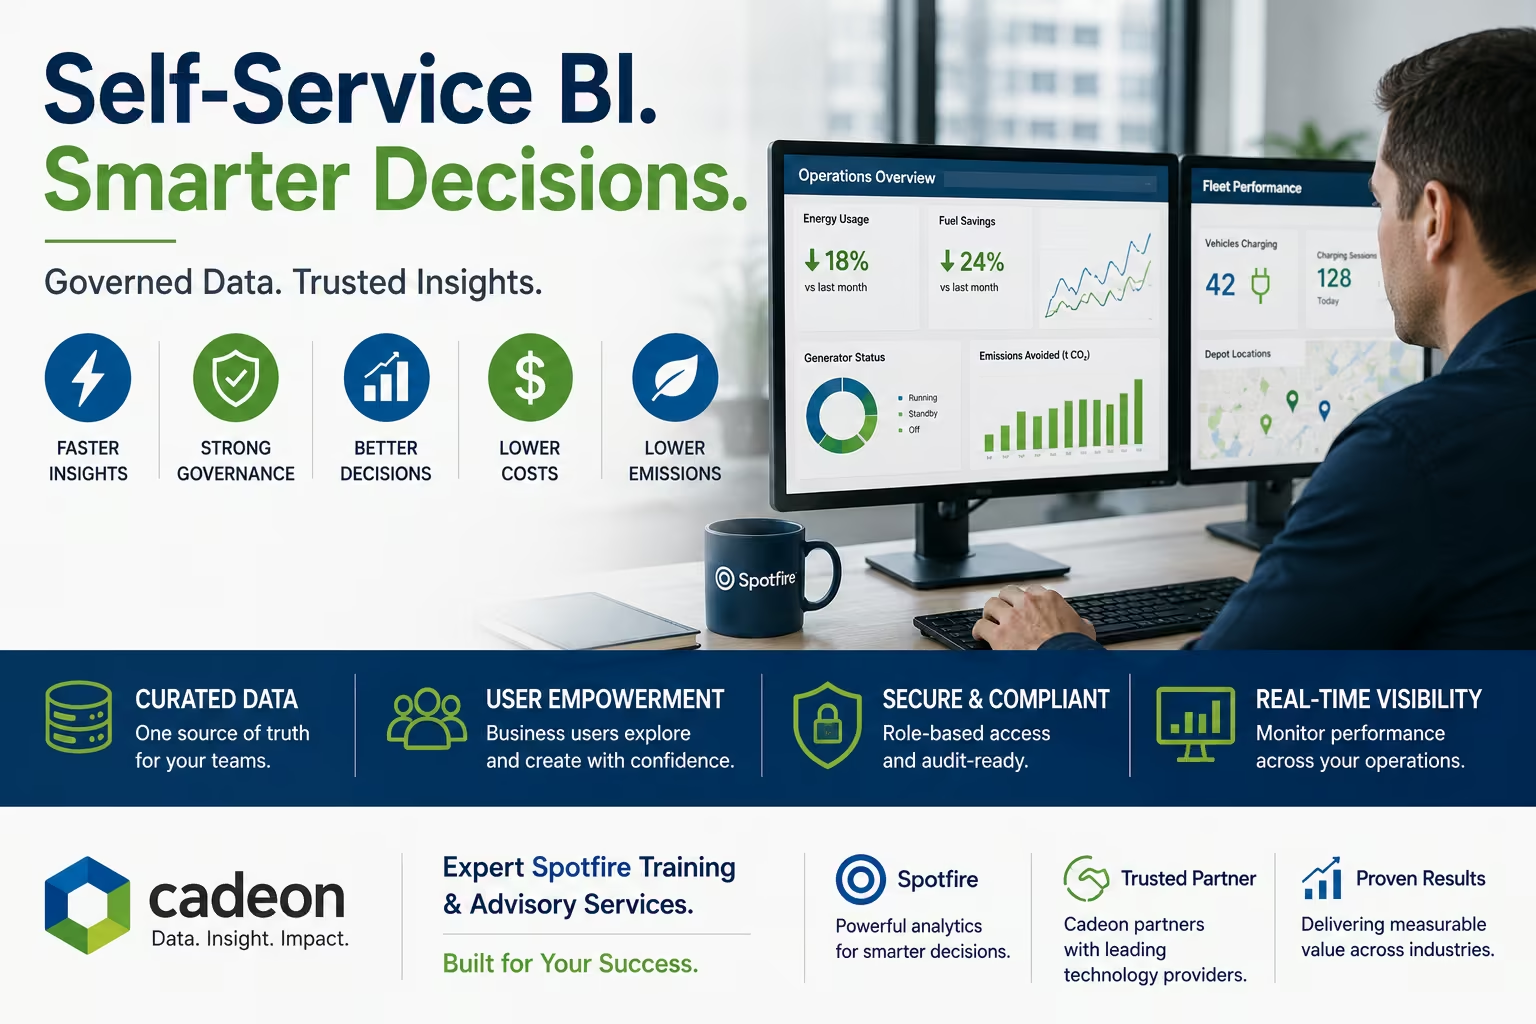
- Cadeon helps design, build, and modernize data warehouse platforms using technologies like Spotfire and Microsoft analytics tools.
Table of Contents
- What is a data warehouse?
- How a data warehouse fits in your analytics stack
- Core components of data warehouse architecture
- Data warehouse design best practices
- Key benefits of a modern data warehouse
- Common data warehouse use cases
- Data warehouse vs data lake vs lakehouse
- Signs you’re ready for a data warehouse
- How Cadeon can help
- Next steps
If you’ve ever spent a week wrestling with spreadsheets just to answer a simple question about last quarter’s results, you’re not alone. Many teams have more data than they know what to do with, scattered across ERPs, CRMs, production systems, and finance tools.
A data warehouse pulls that information into one trusted place, so leaders can ask clear questions and get consistent answers without heroic manual work every month. Done well, it becomes the backbone of reporting, analytics, and decision-making across your organization.

A centralized data warehouse becomes the shared source of truth for analytics teams across the business.
What is a data warehouse?
At its core, a data warehouse is a central, query-friendly database that stores integrated, historical data from across your business. Unlike an operational system (like your ERP or production control system), a warehouse is built for analytics, not for day‑to‑day transactions.
Classic data warehouse analytics use cases include:
- Executive dashboards and KPI scorecards
- Year-over-year trend analysis by region, product, or asset
- Regulatory and compliance reporting
- Feeding business intelligence (BI) tools such as Spotfire, Power BI, or Tableau
Industry analysts sometimes call this an enterprise data warehouse (EDW) when it spans multiple departments, or a data mart when it focuses on a single area like finance or operations.
For a short formal definition, you can think of it as “a subject‑oriented, integrated, time‑variant, non‑volatile collection of data to support management’s decision making,” a description that has been widely referenced in data management circles for years and still holds up today. For a quick external reference, see the overview from Wikipedia on data warehousing.
How a data warehouse fits in your analytics stack
In a modern analytics stack, the warehouse usually sits between your source systems and your visualization tools:

The data warehouse acts as the governed layer between raw source systems and the BI tools your teams rely on.
- Source systems: ERPs, CRMs, line-of-business apps, IoT/SCADA, HR, finance, marketing platforms.
- Data integration: ETL/ELT tools, data virtualization, message queues, and APIs.
- Data warehouse: Integrated, modeled, historical data with consistent business rules.
- BI & analytics: Spotfire, Power BI, Excel, custom apps, and data science notebooks.
When teams skip the warehouse layer and connect BI tools straight to source systems, they often see:
- Conflicting KPI definitions across departments
- Slow dashboards that time out during executive meetings
- Manual extracts living in personal spreadsheets and email threads
A well-designed warehouse lets you move that logic into a shared, governed layer. At Cadeon, we often pair this with data governance and analytics services so that analytics teams finally work from the same playbook.
Core components of data warehouse architecture
While every organization is different, most data warehouse architectures share a few common building blocks.

Behind the scenes, a well-structured data warehouse architecture organizes raw data into reliable layers for analytics.
1. Data sources and ingestion
Data flows from your operational systems into the warehouse through batch loads, streaming pipelines, or a mix of both. Typical sources include:
- Operational databases (SQL Server, Oracle, SAP, etc.)
- Cloud apps (Salesforce, Workday, ServiceNow)
- Industrial and IoT data (SCADA, sensors)
- Flat files, spreadsheets, and external data feeds
2. ETL vs ELT
You’ll hear two common patterns in data warehouse design:
- ETL (Extract–Transform–Load): Clean and reshape the data before loading it into the warehouse.
- ELT (Extract–Load–Transform): Load raw data first, then use the warehouse engine for transformations.
Cloud platforms such as Google BigQuery, Snowflake data warehouse, and Azure Synapse Analytics often favor ELT because of their scalable compute layers. On-premises platforms can lean either way, depending on tools and constraints.
3. Storage layers: staging, core, marts
A classic data warehouse architecture separates data into layers:
- Staging layer: Raw or lightly processed data landed from source systems.
- Core layer: Clean, integrated data model (often using dimensional models such as star schemas).
- Data marts: Business‑friendly subsets for finance, operations, marketing, etc.
This layered approach makes change easier to manage. You can onboard a new source into staging, integrate it into the core model, and then surface it to the right marts without breaking downstream analytics every week.
4. Semantic layer and BI tools
On top of the warehouse, many organizations add a semantic layer: curated views, business-friendly field names, and governed KPI definitions. BI tools such as Spotfire dashboards or Power BI then connect to that layer for self‑service analytics.
This separation is key: analysts can explore data safely, while architects keep control over security, performance, and core definitions.
Data warehouse design best practices
Good data warehouse design isn’t about fancy technology; it’s about making data trustworthy and useful. A few principles come up again and again in successful projects.
1. Model around the business, not the source systems
Dimensional modeling (facts and dimensions) is still the workhorse for reporting. Think in terms of:
- Facts: Measures you want to sum or average (sales, production volume, downtime hours).
- Dimensions: Ways you want to slice those measures (time, location, product, asset, customer).
A classic star schema keeps queries simple and fast while hiding messy source‑system details from end users.
2. Build in governance and security from day one
Data warehouse analytics often include sensitive subjects: financials, payroll, regulatory data, and operational metrics that competitors would love to see. Your architecture should include:
- Role‑based access control (for example, by business unit or geography)
- Row‑level and column‑level security where required
- Clear stewardship: who owns which data domains and definitions
- Audit logging for changes and access
3. Design for performance and growth
Dashboards that take 90 seconds to load rarely get used, no matter how pretty they look. In your architecture and data warehouse design, pay attention to:
- Partitioning and clustering strategies for large fact tables
- Indexing and compression options offered by your platform
- Workload management and query concurrency limits
- Archiving strategies for very old data
Whether you run on-premises or in the cloud, simple choices early on such as keys, granularity, and naming can make life much easier later.
Key benefits of a modern data warehouse
“The real value of a data warehouse isn’t storing data. It’s deciding which version of the truth everybody agrees to use.”
When organizations modernize their warehouse, they usually see benefits on three fronts: speed, trust, and reach.

A modern data warehouse underpins executive dashboards that drive faster, more confident decision-making.
- Speed: Standard reports that once took days to compile run in minutes or seconds.
- Trust: Executives stop arguing about whose spreadsheet is “right” and focus on decisions.
- Reach: More people can get answers on their own, without filing a ticket with IT.
Independent research backs this up: McKinsey has reported that data-driven organizations are more than 20 times more likely to acquire new customers and nearly 20 times more likely to be profitable than their peers, underscoring the impact that strong analytics foundations can have on business performance.
One real-world example: in an energy-sector engagement, Cadeon helped drilling and completions teams replace manual spreadsheets with governed Spotfire dashboards built on an integrated data platform, reducing reporting and dashboard generation time by roughly 75%, cutting manual data processing effort by about 40%, and increasing dashboard data accuracy by around 30%. You can explore the details in our operational dashboards in energy case study.
A strong warehouse also lays the groundwork for advanced analytics. Data scientists need clean, well‑structured inputs just as much as finance or operations teams do. Feeding models from an organized warehouse beats scraping data from random CSV exports every time.
For many Cadeon clients, the warehouse sits at the heart of a broader $10K Digital Transformation Challenge, where we aim to prove measurable value from better information in weeks, not years.
Common data warehouse use cases
Here are a few scenarios where a data warehouse reliably pays off, especially in data‑intensive industries like energy, utilities, manufacturing, and financial services.
1. Executive dashboards and KPI reporting
Leadership teams want one place to see revenue, margins, production, safety, and customer metrics. A warehouse brings those numbers together, applying consistent definitions for terms like “production day,” “active customer,” or “operating unit.”
2. Operations and asset performance
For asset‑heavy organizations, operations leaders want to compare plants, wells, or facilities on an apples‑to‑apples basis. Data warehouse analytics can show:
- Downtime by asset, cause, and vendor
- Throughput vs. plan across sites
- Maintenance patterns that hint at reliability issues
Cadeon often couples this with energy and utilities dashboards.
3. Financial analytics and regulatory reporting
Finance teams rely on historical, reconciled data for forecasting and compliance. A warehouse makes it possible to:
- Align general ledger, subledgers, and operational data
- Track changes over time with clear audit trails
- Generate repeatable regulatory and board reports
4. Advanced analytics and machine learning
When engineers or data scientists build models for example, to predict equipment failures or optimize logistics they need large, consistent datasets. A well‑structured warehouse becomes the clean source feeding those efforts, whether the models run in Python, R, or specialized platforms.
Data warehouse vs data lake vs lakehouse
With the rise of cloud storage, many teams ask: “If we have a data lake, do we still need a warehouse?”
In short:
- Operational database: Optimized for transactions (insert/update/delete), not analytics.
- Data warehouse: Optimized for analytics on structured, modeled data.
- Data lake: Stores raw, often semi‑structured files (logs, JSON, sensor feeds, etc.).
- Lakehouse: A newer pattern that combines lake storage with warehouse‑like tables and governance.
Many modern platforms blur these lines, but the design questions remain the same: where will business rules live, who will trust the data, and how easy is it for people to query?
For deeper dives into lakehouse patterns and trade-offs, you can review the Databricks lakehouse overview and this neutral data warehouse vs data lake vs lakehouse explainer.
Signs you’re ready for a data warehouse
Not every organization needs a full enterprise warehouse from day one. Here are some common signals from Cadeon clients that the time has come:
- Reports from different departments disagree on “simple” numbers.
- Key dashboards break whenever someone tweaks a source system.
- Analysts spend more time hunting, cleaning, and reconciling data than analyzing it.
- Regulators and auditors ask for repeatable, documented reporting processes.
- Your current analytics platform groans under growing data volumes.
If two or three of these sound familiar, you’re likely ready for at least a focused data mart and a roadmap toward a broader warehouse.
How Cadeon helps with data warehouse architecture and analytics
Cadeon has been helping organizations in Canada, the United States, and beyond turn information into money since 2007. Data warehouse analytics is a major part of that story.
Typical ways we help include:
- Data warehouse strategy and roadmap: Assessing current reports, systems, and pain points; defining a practical architecture.
- Data warehouse design and implementation: Modeling, ETL/ELT pipelines, data virtualization, and governance.
- Analytics and visualization: Building Spotfire dashboards, self‑service models, and training teams to use them.
- Modernization and cloud migration: Moving legacy warehouses to modern platforms while protecting business continuity.
Many clients start with our low‑risk $10K Digital Transformation Challenge to prove value on a specific use case before scaling; across these projects, organizations have collectively saved thousands of hours per year on reporting and reduced manual calculation errors by more than 80% by automating their analytics workflows.
Ready to clean up your reporting and analytics?
If your team is wrestling with conflicting reports or fragile spreadsheets, a focused data warehouse project can change the game. Talk with Cadeon’s advisors about where to start.
Next steps: A 5-step data warehouse quick-start
You don’t need a massive, multi‑year program to benefit from better data warehouse design. In fact, smaller, targeted wins often build more trust.
- Pick one high‑value problem (for example, monthly executive reporting or downtime analysis).
- Define the core KPIs and questions that problem needs to answer.
- Design a simple warehouse model that supports those KPIs and connects to your BI tool.
- Roll it out to a small group, gather feedback, and refine.
- Expand from there into broader domains like finance, operations, or regulatory reporting.
If you’d like a second set of eyes on your architecture or need help getting from ideas to results, the Cadeon team is here to help.
Ready to transform your data strategy?
You might also like
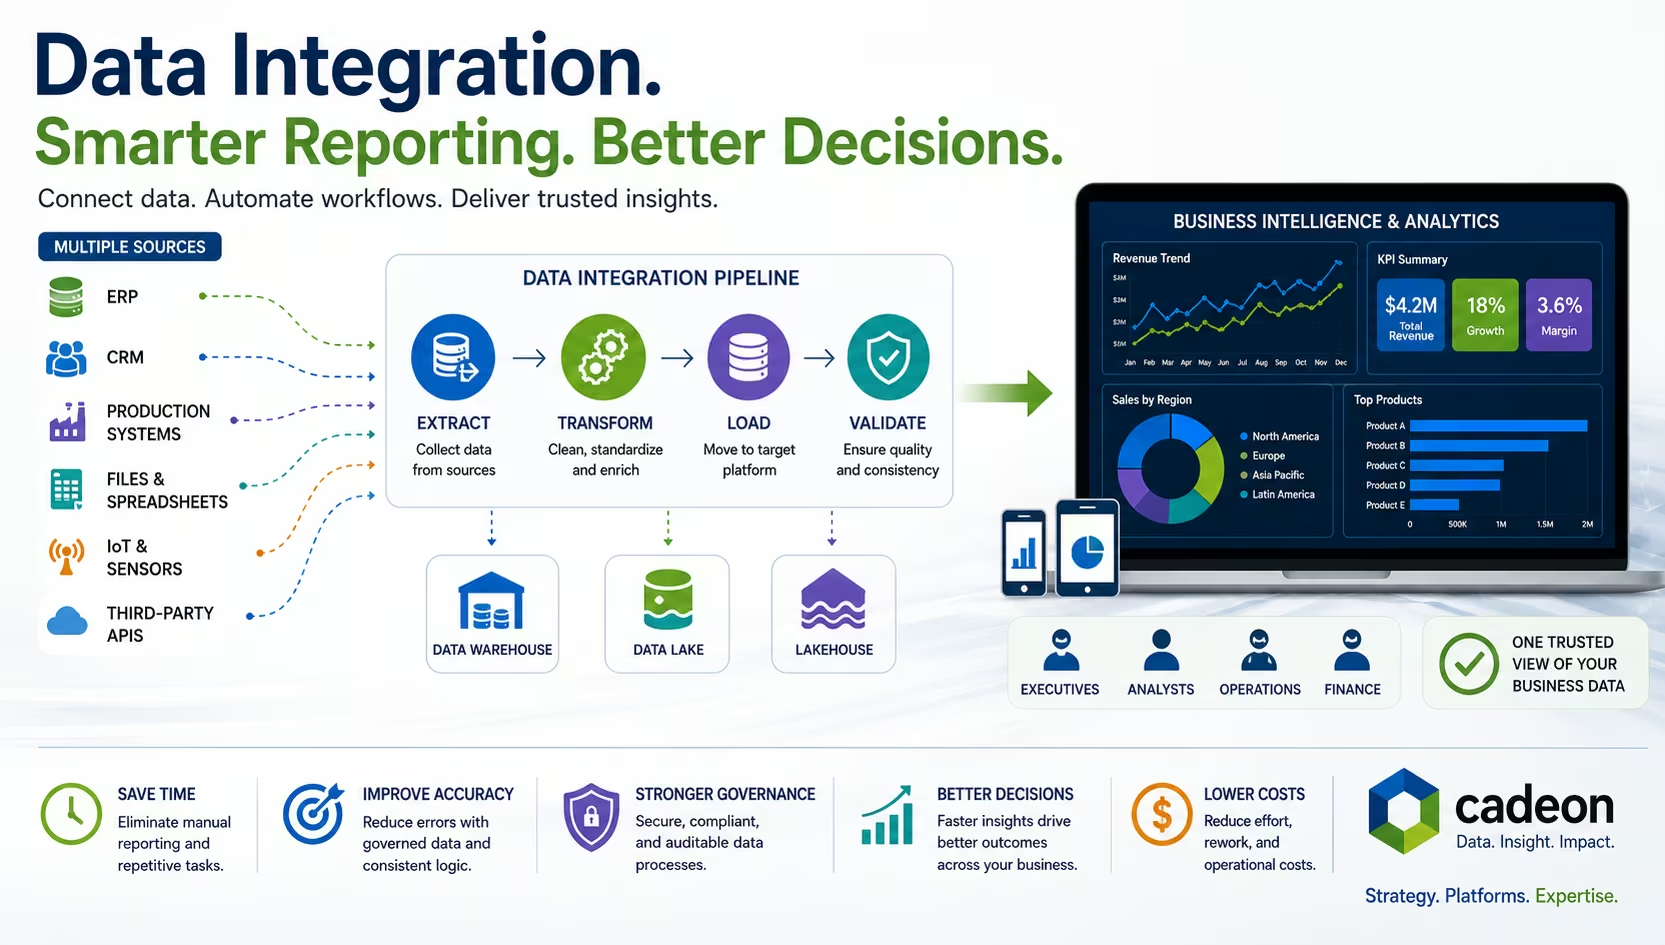
What Is Data Integration? Methods, Tools, and BI Explained
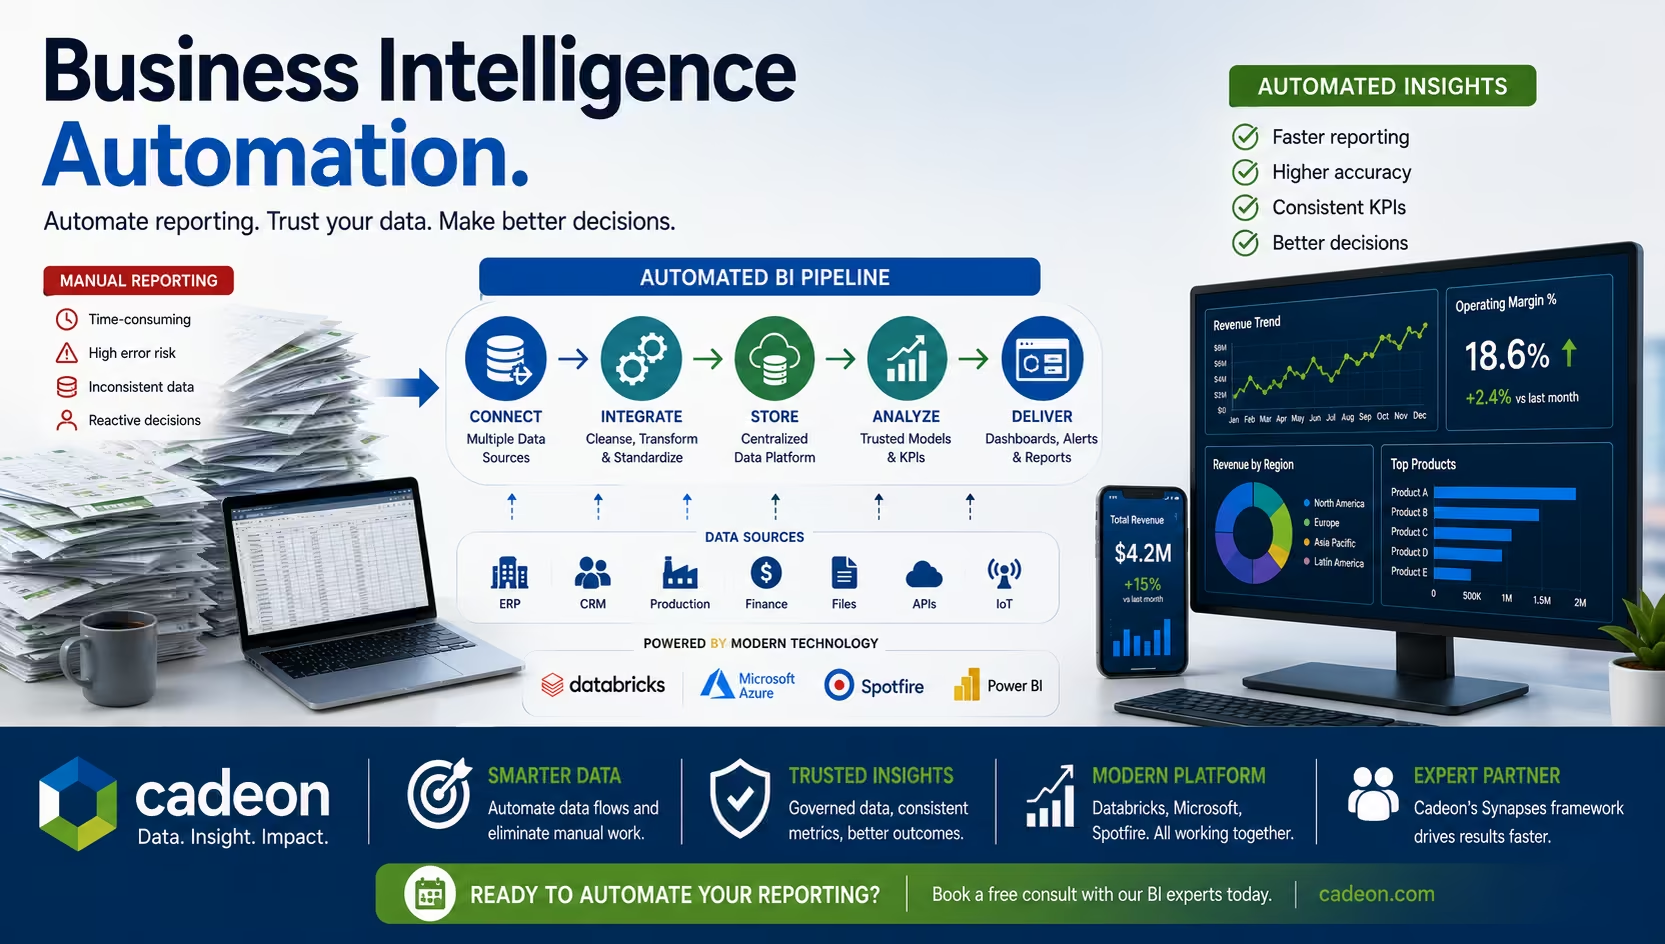
Business Intelligence Automation for Faster Reporting & Insights