How Real-Time Analytics Drives Faster Business Growth
TL;DR
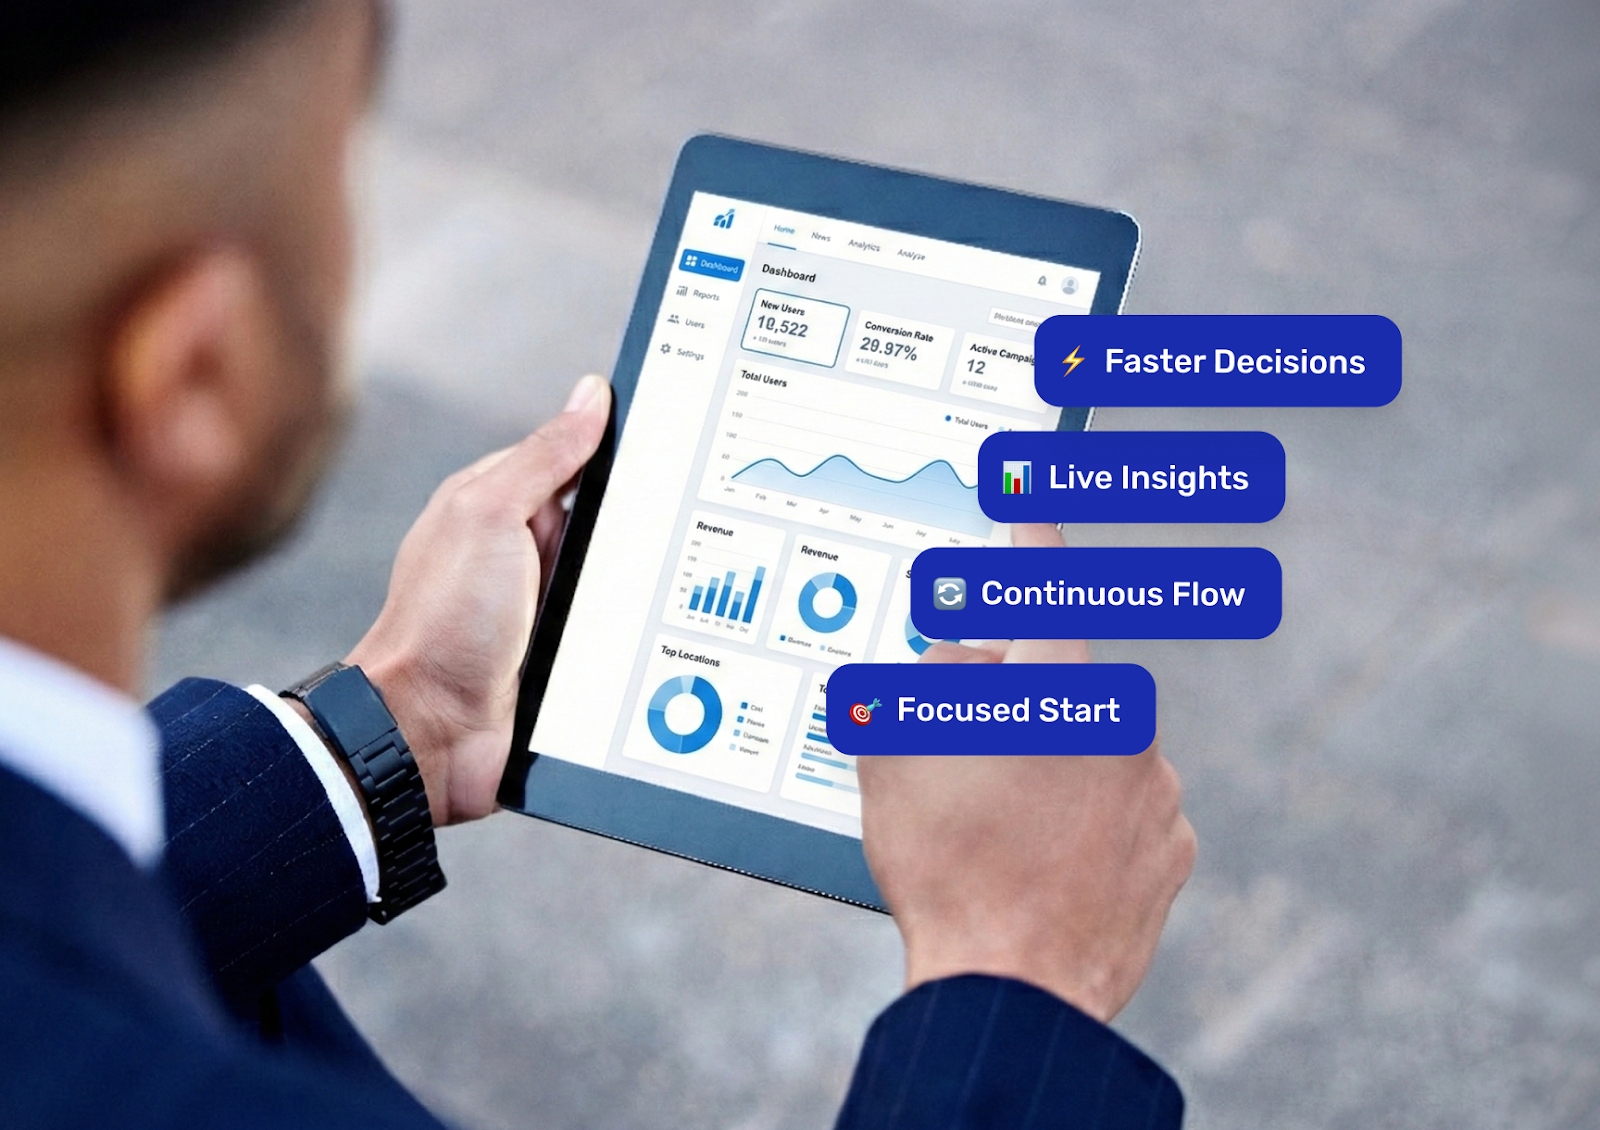
- Leaders don’t just need more data; they need answers while decisions are still on the table.
- Real-time analytics connects live data, smart rules, and intuitive dashboards so teams can act in minutes, not months.
- Start by focusing on one high-value decision, then design the right data feeds, alerts, and workflows around it.
- With the right real time analytics platform, you can turn slow, manual reporting into a steady flow of decision-ready insight.
Table of contents
- What is real-time analytics (and what counts as “real time”)?
- Why speed of insight now beats size of data
- How real time data analytics works in practice
- Real-time analytics use cases across industries
- What to look for in a real time analytics platform
- Five steps to making faster decisions with your data this quarter
- How Cadeon helps teams move from static reports to real-time decisions
- Common pitfalls (and how to sidestep them)
- Where to start if you’re still living in spreadsheets
You know the feeling: the board meeting is tomorrow, the market has shifted again, and your team is still chasing down last week’s numbers in a maze of spreadsheets and email threads. By the time the report finally lands, the decision you needed it for has already passed. That gap between when data is produced and when leaders see it is exactly where real-time analytics earns its keep.
In this article, we’ll break down what “real time” really means, how it changes day-to-day decision-making, and what it takes to build a real time analytics platform your teams can trust. You’ll see practical examples from operations, finance, and customer experience, plus a simple five-step playbook you can start using this quarter.
What is real-time analytics (and what counts as “real time”)?
At a simple level, real time data analytics means processing and analysing data as it’s generated, then pushing the result straight into the decisions and workflows that matter. Analysts don’t wait for an overnight batch, and business users don’t wait for a monthly slide deck. Insight shows up while the event is still happening.
Industry definitions differ slightly, but research firms like Gartner frame it as applying logic and mathematics to data quickly enough that it can shape the decision at hand, whether that response happens in seconds or just a few minutes.
In practice, most organizations land in one of three zones:
- True real time: Sub-second reactions for trading, equipment safety, fraud checks, or customer interactions.
- Near real time: Dashboards and alerts updating every few seconds or minutes for operations, supply chain, or service desks.
- Fast batch: Automated refreshes every 15–60 minutes for executives who need the latest picture during the workday.
All three can fall under “real-time analytics” as long as the latency matches the pace of the decision.
Why speed of insight now beats size of data
Many teams already have data warehouses, BI tools, and rows of historical reports. The real friction shows up when leaders ask, “What’s happening right now?” and the answer is either, “We’ll get back to you next week,” or “We’re not sure we can trust that number.”
Studies from firms such as McKinsey show that organizations using data to drive everyday decisions often see measurable lifts in revenue and productivity. The edge doesn’t come from hoarding more data,it comes from shrinking the time between event, insight, and action.
“The value of data decays with every hour you wait to use it. In fast-moving operations, yesterday’s truth can already be wrong.”
When you connect operations, finance, and customer data in near real time, you:
- Spot problems while they’re still small: production slowdowns, anomalies, or data quality issues.
- React to changes in demand or pricing before competitors do.
- Give front-line teams confidence that the number on their screen reflects today, not last quarter.
That shift from hindsight to “live sight” is where real-time analytics pays for itself.
How real time data analytics work in practice
Under the hood, real-time analytics follows a familiar pattern: collect, process, analyse, and present. The difference is that everything is designed for continuous flow instead of one-off batches.
Key building blocks
- Streaming data sources: Sensors, production systems, POS terminals, trading platforms, web and mobile apps, or ERP and CRM events.
- Data transport: Message queues and streaming tools (e.g., Kafka, cloud message buses) that move events as they happen.
- Processing and rules: Stream processing engines, business rules, and models that calculate KPIs, thresholds, and predictions continuously.
- Serving layer: Dashboards, APIs, and alerts that expose fresh metrics to people and systems.

Modern platforms can combine streaming and historical views, so a supervisor can see both current production rates and how they compare to the last month. Concepts such as hybrid transactional/analytical processing (HTAP) are making that blend more common in enterprise data stacks.
At Cadeon, we often wire these components into tools such as Spotfire, using data virtualization to bring many sources together without creating yet another copy of the data.
Real-time analytics use cases across industries
The patterns are surprisingly consistent across sectors. Here are a few examples we see most often.

- Energy and utilities: Monitor production, downtime, and safety events minute by minute; alert engineers when wells, plants, or lines drift out of targets; share live operational dashboards across the field and head office.
- Manufacturing: Track throughput, scrap, and machine health in near real time; spot bottlenecks before they turn into missed orders; feed alerts into maintenance and scheduling systems.
- Transportation and logistics: Combine telematics, shipment, and inventory data so dispatchers see loading delays, route issues, and at-risk deliveries as they happen.
- Financial services: Score transactions against fraud and risk rules while the customer is still at the point of sale; watch liquidity and exposure numbers throughout the day.
- Sports and entertainment: Blend ticketing, concessions, staffing, and IoT data to tune pricing, staffing, and fan experience in real time. Cadeon has helped a major venue group build this kind of real-time analytics platform to support event operations.
External guides from vendors like Cloudera and Sisense highlight similar patterns: live KPIs, alerts, and embedded analytics becoming part of daily workflows, not just executive dashboards.
What to look for in a real time analytics platform
Choosing tools is only one part of the decision, but it matters. Here are some practical questions to ask when you assess a platform or architecture.
1. Can it connect to the systems you run today?
Your platform should plug into core systems (ERP, CRM, production, finance) plus semi-structured sources such as logs and IoT feeds. Tools like Spotfire, combined with data virtualization, help you bring those sources together without months of custom integration work.
2. How fresh is “fresh”?
For each use case, define an acceptable delay: seconds, minutes, or hours. Then ask vendors to show how their platform meets that requirement with real data volumes, not just lab demos. This is where partnering with experienced data consulting and implementation teams pays off.
3. Will front-line users actually use it?
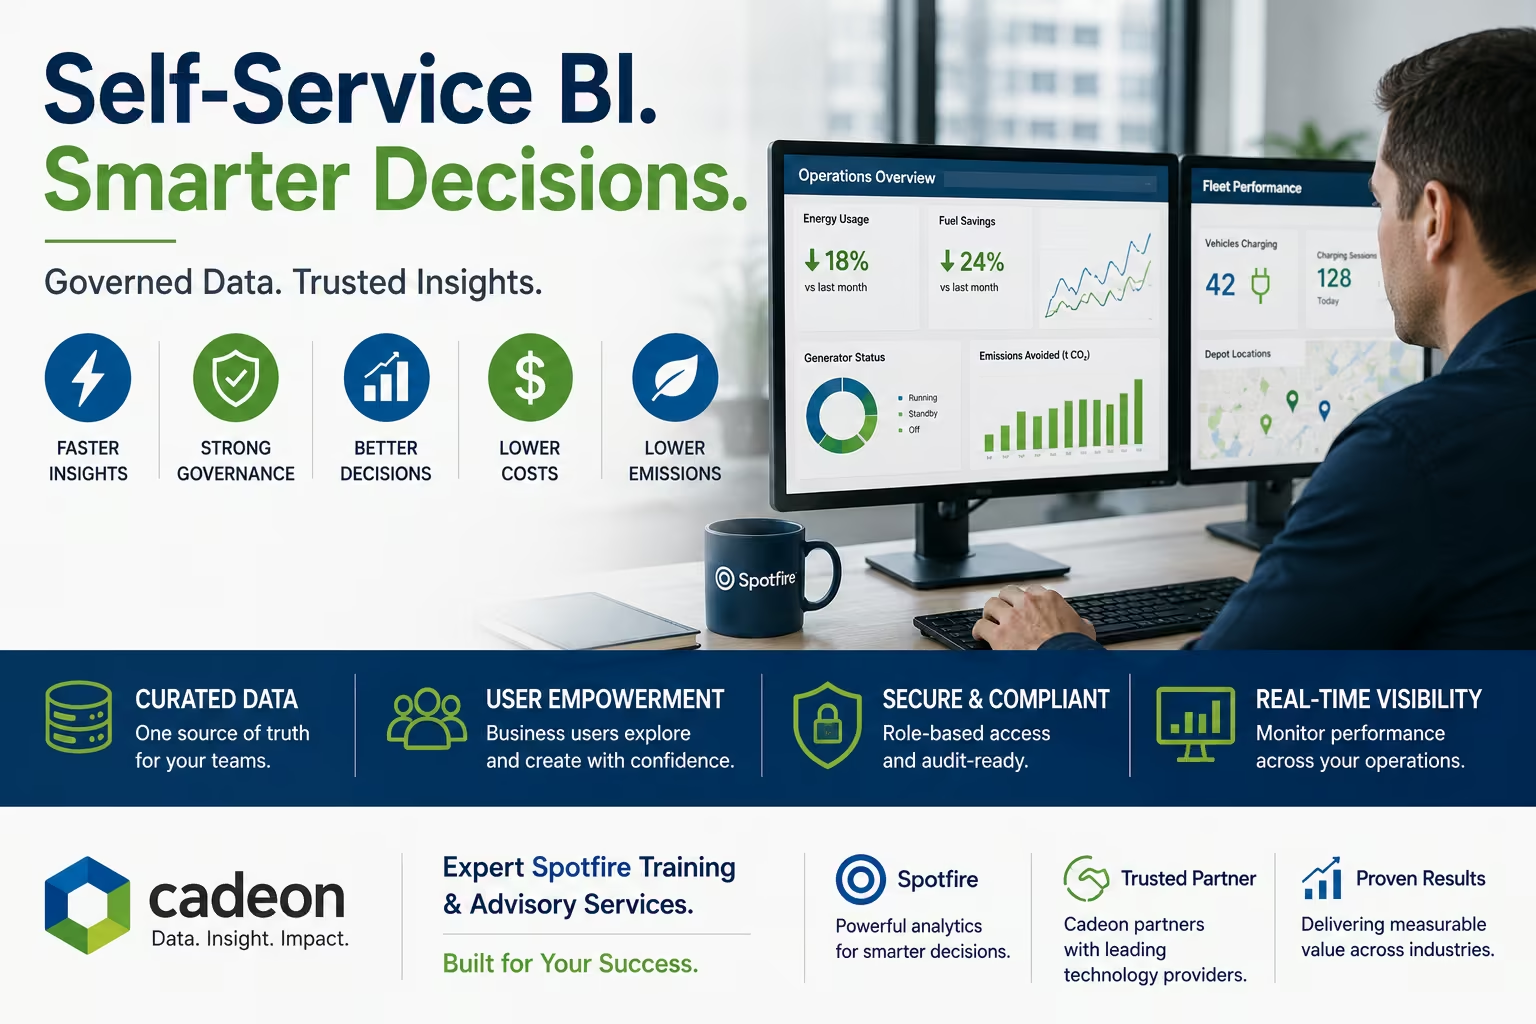
Dashboards must be simple, intuitive, and relevant to the person on shift. Role-based views, clear KPIs, and guided workflows all help with adoption. Cadeon’s Spotfire training and ongoing Spotfire support are designed to make sure tools become part of everyday routines, not just an IT project.
4. Does it respect governance and security?
Enterprise environments need row-level security, audit trails, access controls, and clear data lineage. Any real-time solution has to align with your governance framework instead of bypassing it.
Five steps to making faster decisions with your data this quarter
You don’t need to rebuild your entire data estate to see benefits. Many Cadeon projects start small and grow from a single, well-chosen win.
- Pick one high-value decision that suffers from stale data.
For example: daily production meetings, inventory allocations, credit approvals, or customer retention actions. If the answer arrives late today, does it cost real money or risk? - Map the data and current latency.
Where does the data come from? How often does it update now? Who touches it on the way to the decision-maker? This step usually reveals manual exports, spreadsheet merges, and email chains that can be streamlined. - Define “good enough” real time.
Decide what window matters: every 30 seconds, five minutes, hourly. Being precise here keeps expectations realistic and budgets under control. - Design a focused dashboard and alerting flow.
Work with business users to set the few metrics and thresholds that matter. Use your real time analytics platform (for example, Spotfire with live data connections) to surface:- Live KPIs against targets
- Trend lines and context versus history
- Alerts routed to the right person or team when thresholds are crossed
- Run a 4–6 week pilot and measure the impact.
Track cycle times, incident counts, manual effort, and user feedback before and after. Cadeon’s $10K Digital Transformation Challenge is one way to structure this kind of focused, time-boxed proof of value.
Once you have one decision running on real-time data, it becomes much easier to expand to adjacent areas using the same patterns and infrastructure.
How Cadeon helps teams move from static reports to real-time decisions
Since 2007, Cadeon has helped organizations across energy, utilities, manufacturing, financial services, and sports and entertainment turn information into money. A big part of that work is shifting from monthly reports to live, interactive analytics that leaders can act on.
Our approach combines:
- Spotfire-centric analytics: Designing and building interactive dashboards and real time analytics solutions on top of Spotfire.
- Data virtualization and integration: Connecting disparate systems into a unified, governed view without endless ETL projects.
- Training and enablement: Practical Spotfire training and expert support so your teams can manage and extend solutions themselves.
- Proof-of-value engagements: Short, focused projects such as the $10K Challenge that demonstrate benefits quickly.
The goal is simple: give decision-makers a trustworthy, real-time view of their world, without asking them to become data engineers in the process.
Common pitfalls (and how to sidestep them)
Real-time projects sometimes struggle not because the technology fails, but because expectations, data, or processes are out of sync. Here are a few patterns we see again and again:
- No shared definition of “real time”.
One group expects second-by-second updates; another thinks hourly is fine. Set a clear, business-driven latency target for each use case up front. - Streaming bad data faster.
If your source data is inconsistent or poorly governed, streaming it will not fix that. Data quality rules and governance remain essential. - Dashboards that are pretty but puzzling.
If front-line users can’t tell what to do with the insight, they ignore it. Involve them in design, test with real scenarios, and keep visualizations focused. - Skipping process change.
Alerts help only if someone owns the response. For each new metric or alarm, specify who responds, how quickly, and what options they have.
Research from sources such as TechTarget shows that misaligned expectations and weak data foundations are among the biggest reasons real-time initiatives stall. The fix is a balanced focus on people, process, and technology.
Where to start if you’re still living in spreadsheets
If your reporting world still revolves around manual exports and slide decks, jumping straight into real-time analytics can feel like a leap. The most successful leaders start small:

- Choose one recurring meeting or decision that depends on stale data.
- Define the minimum latency that would change outcomes.
- Partner with experienced data consulting experts to design and deliver a focused pilot.
From there, you can scale what works: more data sources, more teams, more decisions supported by live insight instead of best guesses. Over time, your real time analytics platform becomes part of how the business runs, not a side project.
If you’d like to talk through where real-time analytics could make the biggest difference in your organization, you can book a free consult and explore the $10K Digital Transformation Challenge with the Cadeon team.
About the Cadeon Data & Analytics Team
Cadeon Inc. is a Calgary-based data and analytics consultancy helping mid-sized and large organizations across North America build modern, governed analytics platforms. With deep expertise in Spotfire, data virtualization, and enterprise information architecture, the team has delivered hundreds of projects that turn information into measurable business value.
Ready to transform your data strategy?
You might also like
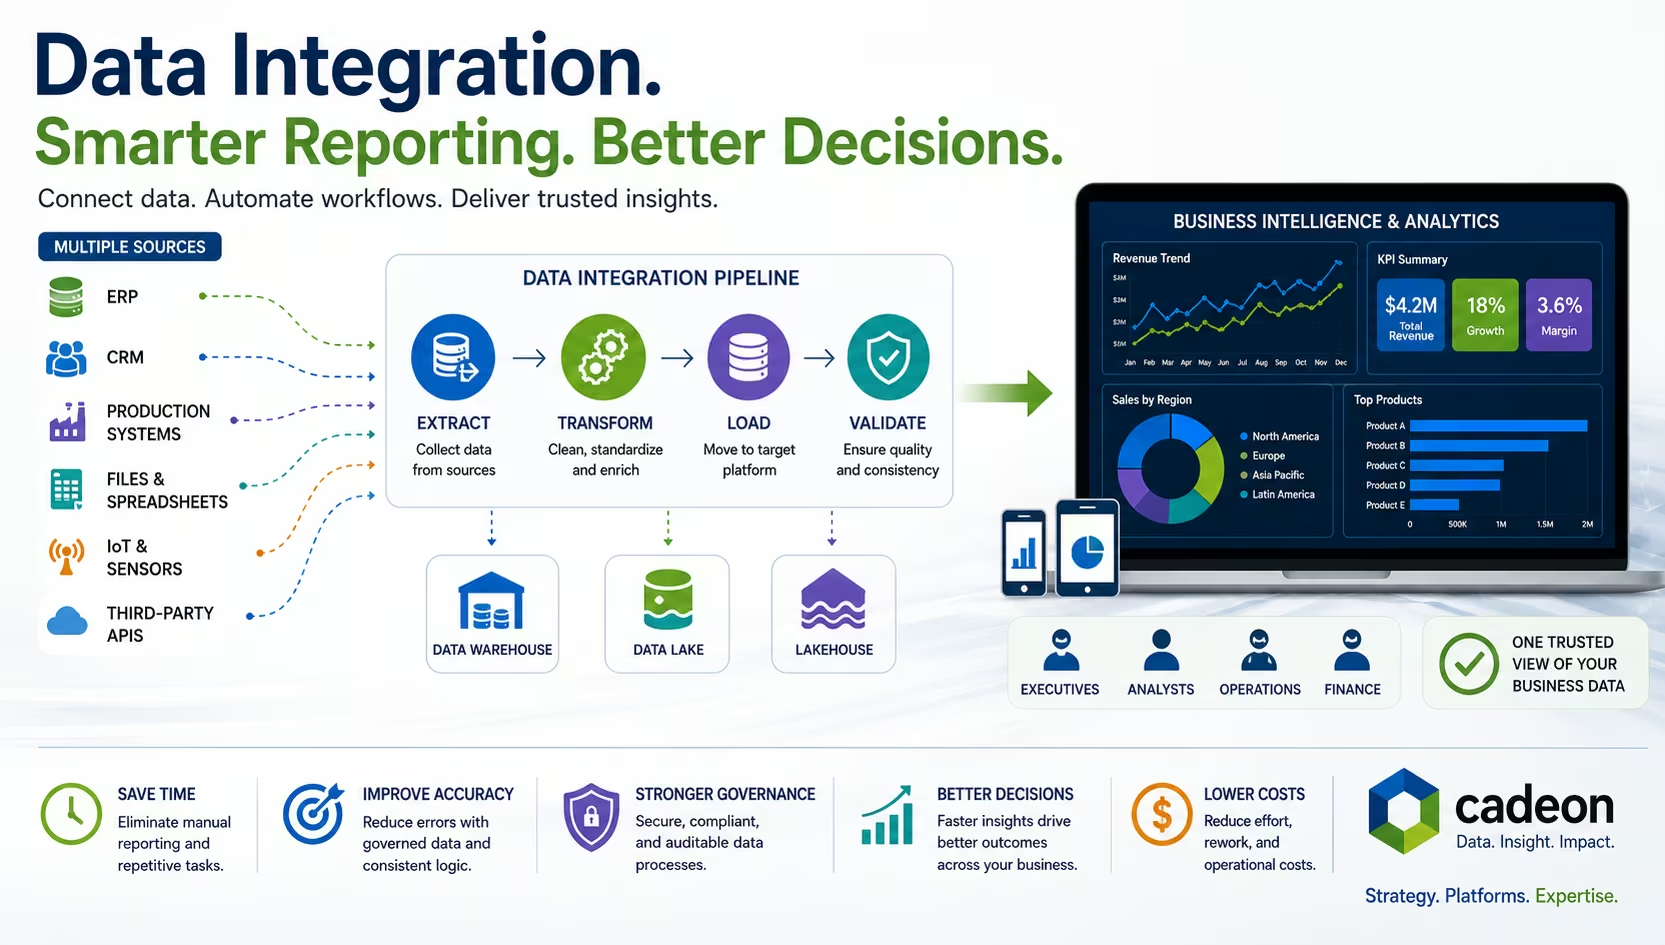
What Is Data Integration? Methods, Tools, and BI Explained
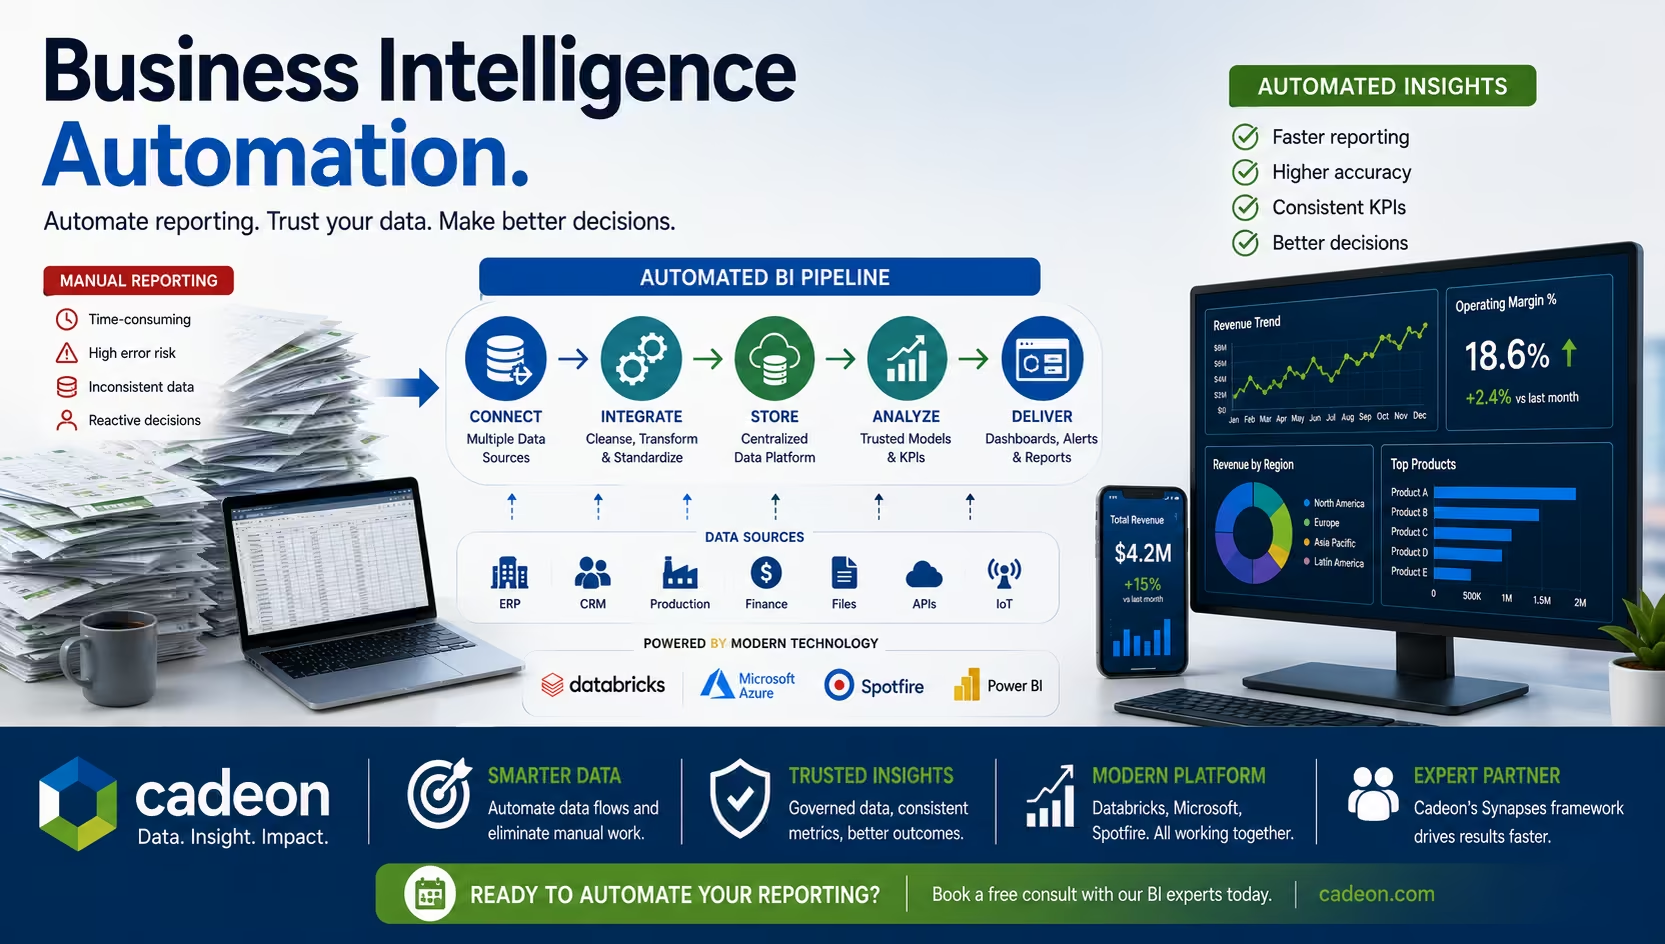
Business Intelligence Automation for Faster Reporting & Insights