What is Data Virtualization for Asset-Intensive Enterprises?
If you work in energy, utilities, manufacturing, or transportation, you’ve probably sat in this meeting: someone needs a new KPI, the warehouse team sighs, and before long, you’re funding yet another “temporary” mart or lake project. Twelve months later, you have one more silo, one more copy of the same data, and still no simple way to answer basic questions.
Leaders keep asking what data virtualization is because they’re tired of this cycle, but don’t want to rip out their existing historians, ERPs, and data warehouses. They want a way to use what they already have, connect it quickly, and give people trusted numbers without another multi‑year rebuild.
TL;DR: A Faster Path Than “One More Warehouse”
- Data virtualization lets you query data where it lives instead of copying it into yet another warehouse.
- It creates a logical layer on top of historians, ERPs, asset systems, and lakes, so users see one consistent view.
- Asset‑intensive enterprises use it to cut reporting cycles, reduce integration costs, and keep OT/IT systems unchanged.
- You still keep warehouses and lakes, but you stop rebuilding them every time the business changes.
- With the right partner, you can prove value in weeks, not years, and scale from there.

A modern asset‑intensive operation connected by a virtual data layer instead of more warehouses.
The Real Problem: “Just One More Warehouse”
Most asset‑intensive organizations didn’t set out to build a maze of data platforms. It happened over years of acquisitions, regulatory changes, and well‑intentioned projects: a production warehouse here, a finance mart there, a cloud lake for data science, a historian upgrade, a new maintenance system.
The result is familiar:
- Multiple “sources of truth” for the same production and cost numbers.
- Long lead times for new reports because every change needs a new ETL pipeline.
- Heavy infrastructure spend just to keep copies of similar data in sync.
Analysts are stuck hunting for data instead of analyzing it. IDC has found that teams often spend around 80% of their time on data preparation and only 20% on actual analysis.1 That pattern matches what we see every week with operations and analytics teams.
When your default answer to a new question is “we need another data project,” your data architecture is working against you, not for you.
So What Does Data Virtualization Actually Mean?
In plain language, data virtualization is a way to give users a unified, queryable view of data without moving or copying it into yet another store.
Instead of writing ETL jobs to shuttle data from your systems into a warehouse, a data virtualization platform sits on top and:
- Connects to your existing sources – historians, SCADA, ERP, EAM/CMMS, finance systems, SQL/NoSQL stores, files, and lakes.
- Maps and standardizes the data into business‑friendly views (for example, “Asset”, “Work Order”, “Well”, “Meter”).
- Exposes those views as if they were tables in a single virtual database.

A logical data layer presents a single, unified view across many underlying systems.
Tools like enterprise data virtualization platforms let Spotfire, Power BI, or other tools query that virtual layer, while the platform handles talking to the underlying systems, optimizing queries, and applying security rules.2
How is this different from classic ETL and warehousing?
- ETL + warehouse: Copy data into a central database on a schedule, then report from there.
- Data virtualization: Leave data in place and query it in real time through a logical layer.
You still might keep some physical copies for performance or history, but you no longer treat “build another warehouse” as the only way to integrate data.
What Virtualized Data Looks Like in an Asset‑Intensive Operation
When people hear “virtualization,” they often picture something abstract. In practice, virtualized data feels very concrete to the engineers and analysts using it.
Picture a reliability engineer who needs to understand why a group of pumps is failing early. Today, they might have to:
- Pull time‑series data from a historian.
- Export work orders from the maintenance system.
- Ask finance for cost data from ERP.
- Manually blend it all in a spreadsheet or BI tool.
With virtualized data, that same engineer sees curated views like:
- Asset – combining attributes from ERP, asset registry, and maintenance systems.
- AssetEvent – blending alarms, sensor data, and work orders.
- AssetCost – linking usage, parts, and labour to actual assets.

Reliability engineers can see asset, event, and cost data together without rebuilding another warehouse.
To them, it behaves like one trusted database, even though the data still lives in several systems. That’s the practical answer when someone asks what is virtualized data on a day‑to‑day basis.
7 Painful Problems Data Virtualization Helps Solve
Data virtualization is not a silver bullet, but it does address some very specific, very expensive problems we see in asset‑intensive enterprises.
1. Endless integration projects
Every new report or dashboard no longer needs a dedicated pipeline. You define reusable virtual views once, then re‑use them across analytics, self‑service, and data science projects.
2. Conflicting “sources of truth”
Business rules – like how you define “downtime,” “throughput,” or “unit cost” – live in the virtual layer instead of dozens of disconnected reports. When those definitions change, you update them once and every downstream consumer benefits.
3. Slow response to regulatory or market change
When a regulator asks for a new view across assets, regions, and years, you can create it in the logical layer without re‑plumbing every source. The same applies when operations leaders need new views of production and cost to manage volatility.
4. High infrastructure and storage costs
You cut down on redundant data copies. Instead of replicating full tables into multiple warehouses and lakes, you cache only where it genuinely helps performance, and let less‑critical queries run live.
5. OT/IT integration headaches
Historians and control systems are sensitive. Virtualization lets you respect those boundaries while still joining OT data with IT systems in a governed way, with clear access controls and audit trails.3
6. Analyst time wasted on hunting for data
Instead of emailing around for table names and Excel exports, analysts search a governed catalog of virtual views with plain‑language descriptions. That directly tackles the 80/20 prep‑vs‑analysis problem mentioned earlier.
7. Risky “big bang” migrations
Want to move a warehouse to the cloud or introduce a new asset system? Virtualization lets you abstract consumers away from the underlying platforms. You can migrate in stages behind the scenes, while users keep hitting the same virtual views.
Where It Fits With Your Warehouses, Lakes, and Historians
A common misconception is that a logical data layer replaces everything you’ve already built. In reality, it sits above those systems and coordinates them.
Many organizations move toward a logical data warehouse or data fabric style architecture, where data virtualization provides the shared access layer over warehouses, marts, lakes, and operational systems.4
In asset‑intensive environments, a typical pattern looks like this:
- Operational systems (ERP, EAM/CMMS, trading, LIMS, etc.).
- OT systems (historians, SCADA, IoT platforms).
- Enterprise warehouse(s) and/or lake for curated and historical data.
- Data virtualization layer exposing cross‑system views to BI tools like Spotfire, self‑service users, and data scientists.
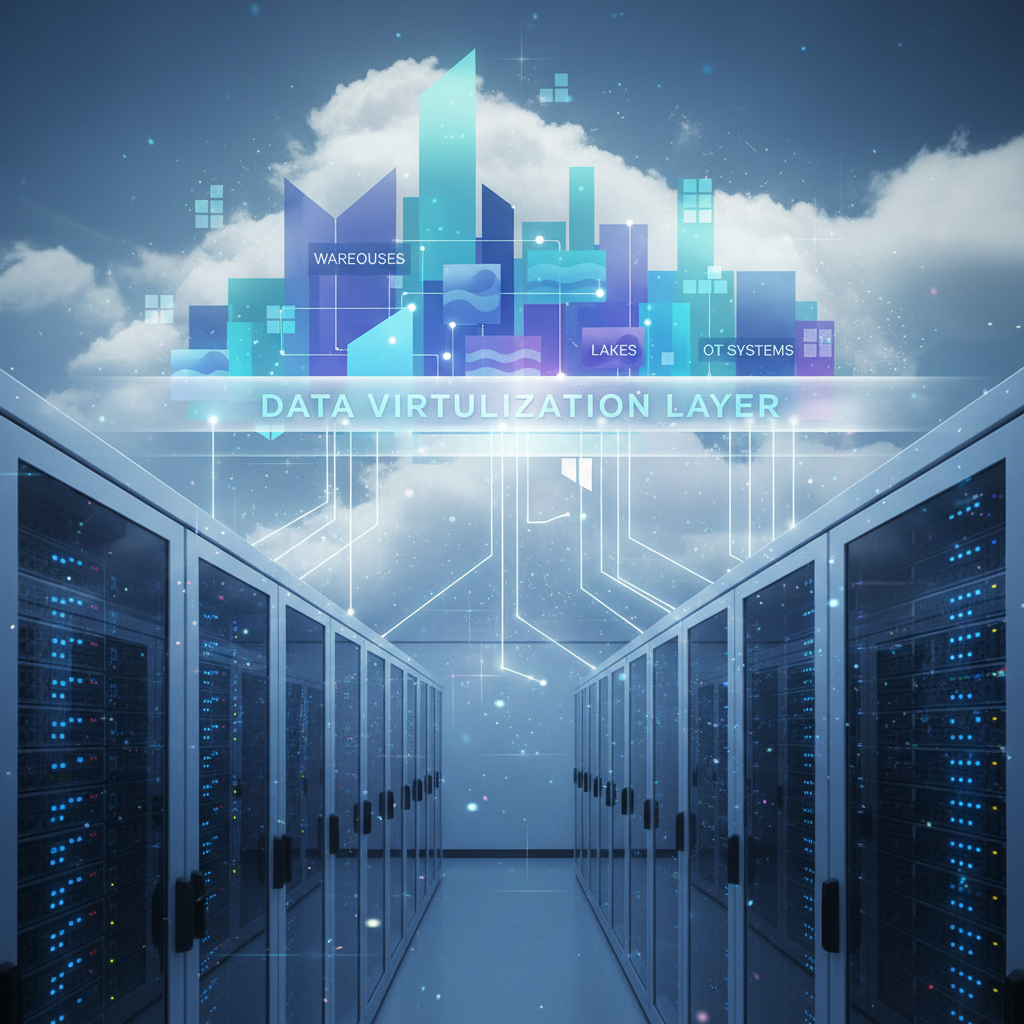
Data virtualization sits above warehouses, lakes, and OT/IT systems as a unifying logical layer.
The payoff is that you can evolve any single layer – swap out a historian, modernize a warehouse, build a new lake – without rewriting every analytical integration.
A Practical Roadmap to Get Started
Moving to a virtualized approach doesn’t have to be a massive, all‑or‑nothing transformation. The most successful teams start small and intentional.
Step 1: Pick one high‑value, cross‑system question
For example: “What is the true cost per unit for this asset class, combining utilization, maintenance, and energy?” Pick something that matters to operations or finance, not just IT.
Step 2: Map the minimal data needed
Identify the handful of systems involved – perhaps a historian, maintenance system, ERP, and your existing warehouse. Resist the urge to connect everything on day one.
Step 3: Build a thin virtual layer and one or two key views
Use a proven platform (for example, TIBCO Data Virtualization / Composite) to connect only those sources and define a small set of curated views. Expose them to an existing analytics tool like Spotfire so users can explore and validate the results.
Step 4: Prove the time‑to‑insight and quality gains
Measure how long it took to answer the question with and without virtualization, how much re‑use you achieved, and how much manual work you eliminated. This gives executives a concrete story instead of a theoretical architecture diagram.
Step 5: Expand in controlled increments
Gradually bring in more systems and domains, guided by the questions that matter most to your business. Keep governance, security, and cataloging front and centre as you grow.
If you’d like help designing that first use case and proving value quickly, you can Book A Free Consult with Cadeon or explore our 10K Challenge engagement to pressure‑test the approach.
How Cadeon Supports Asset‑Intensive Enterprises
Cadeon has been helping organizations in oil & gas, utilities, manufacturing, transportation, and other asset‑heavy sectors organize and virtualize their data for more than 15 years. As a Spotfire consulting partner and data virtualization partner, we work at the intersection of OT, IT, and analytics.
Our approach focuses on:
- Clear use cases: Starting with specific operational and financial questions instead of abstract architectures.
- Practical architecture: Using data virtualization to extend the value of your existing platforms, not replace them for the sake of it.
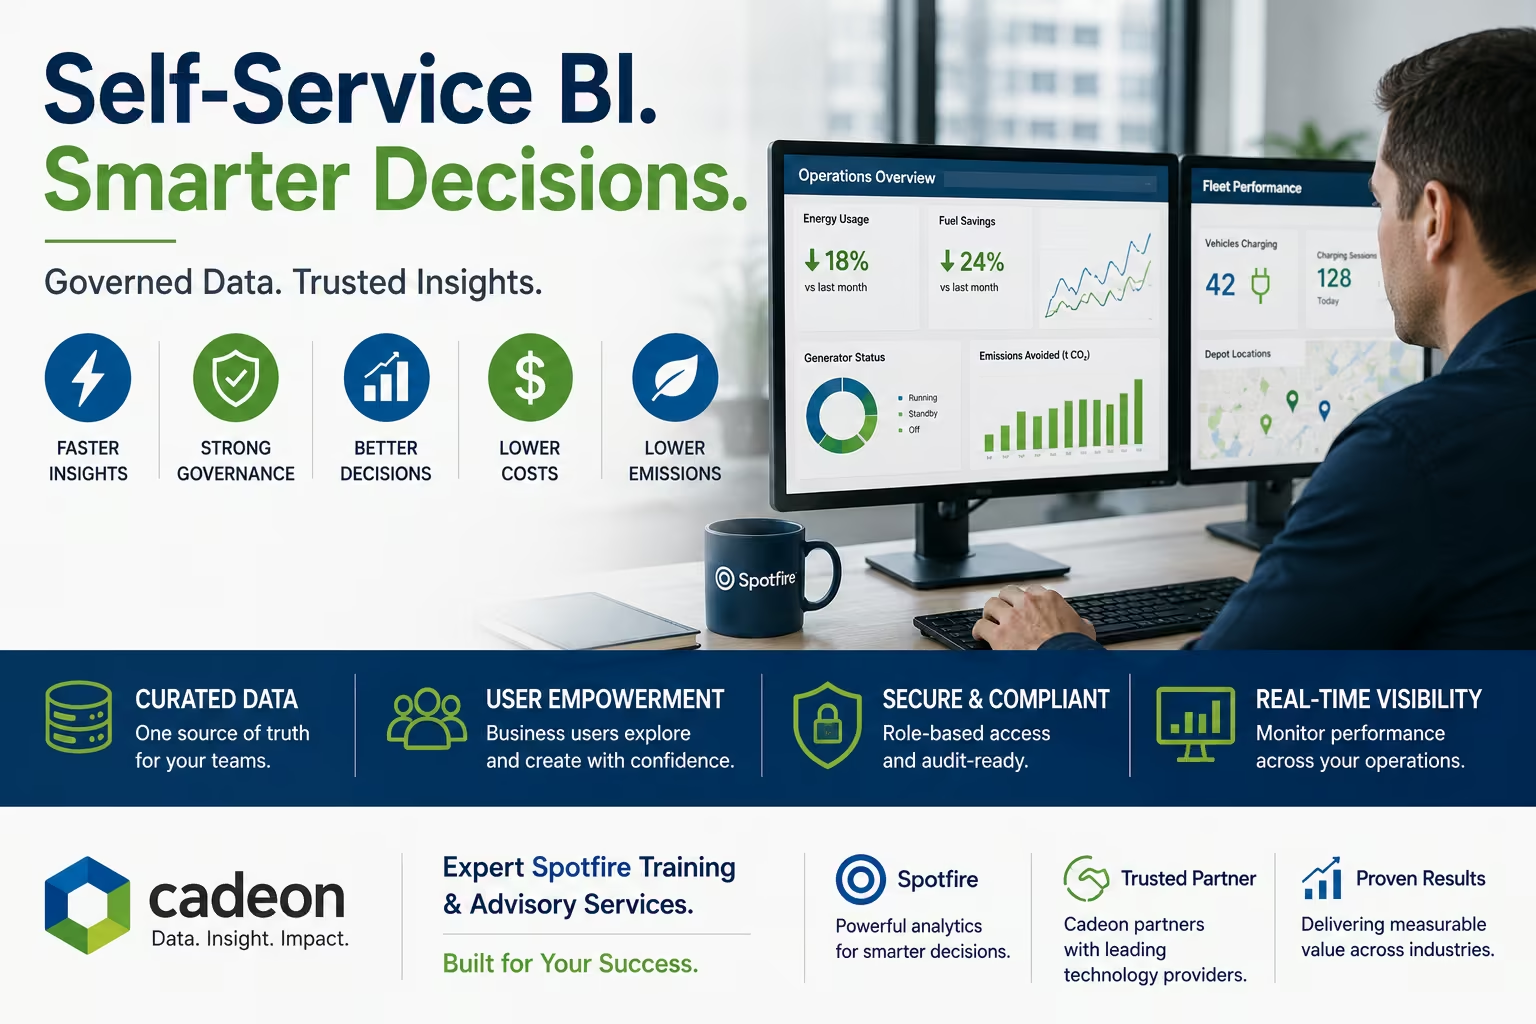
- Governed self‑service: Letting engineers and analysts explore data through tools like Spotfire while still keeping security and definitions consistent; see our services overview.
- Training and enablement: Upskilling your internal teams so they can maintain and extend the virtual layer over time.
For example, in a recent engagement structured as our 10K Challenge, we worked with a mid‑size energy operator to virtualize data from their historian, ERP, and maintenance systems, giving operations and finance a shared cost‑per‑asset view in weeks rather than the months they were used to.
In many cases, clients see first projects delivered significantly faster than earlier warehouse‑centric efforts, with far less disruption to live systems. Over time, they build a catalog of trusted virtual views that serve as the backbone for reporting, analytics, and machine learning.
Frequently Asked Questions
Does data virtualization replace my existing data warehouse?
No. Think of it as a logical layer that uses your warehouses, lakes, and operational systems more effectively. You may choose to retire some legacy stores over time, but that’s a business decision, not a requirement.
Is it only for very large enterprises?
Not at all. Mid‑sized organizations with a few key systems often feel the benefits even more, because they can’t afford repeated large‑scale rebuilds. If you’re already stretching a small data team across endless integration work, virtualization is worth considering.
Will real‑time queries overload my operational systems?
A well‑implemented platform uses caching, query optimization, and workload management to protect source systems. For sensitive OT environments, we design patterns that keep loads predictable and safe while still giving business users fresher data than nightly batches.
Where should I learn more?
You can read Cadeon’s overview of data virtualization solutions, review independent definitions such as the data virtualization entry, or talk with one of our architects about your specific environment.
Key Takeaways
- Data virtualization creates a logical access layer so you can query data where it lives, instead of endlessly copying it.
- Asset‑intensive enterprises use it to reduce integration work, cut reporting time, and keep OT/IT systems stable.
- It complements warehouses and lakes rather than replacing them.
- The best way to start is with one cross‑system, high‑value question and a small virtual layer that proves the concept.
Ready to see how a logical data layer could shorten your next “data project” from months to weeks? Book A Free Consult with Cadeon’s data virtualization experts.
Ready to transform your data strategy?
You might also like
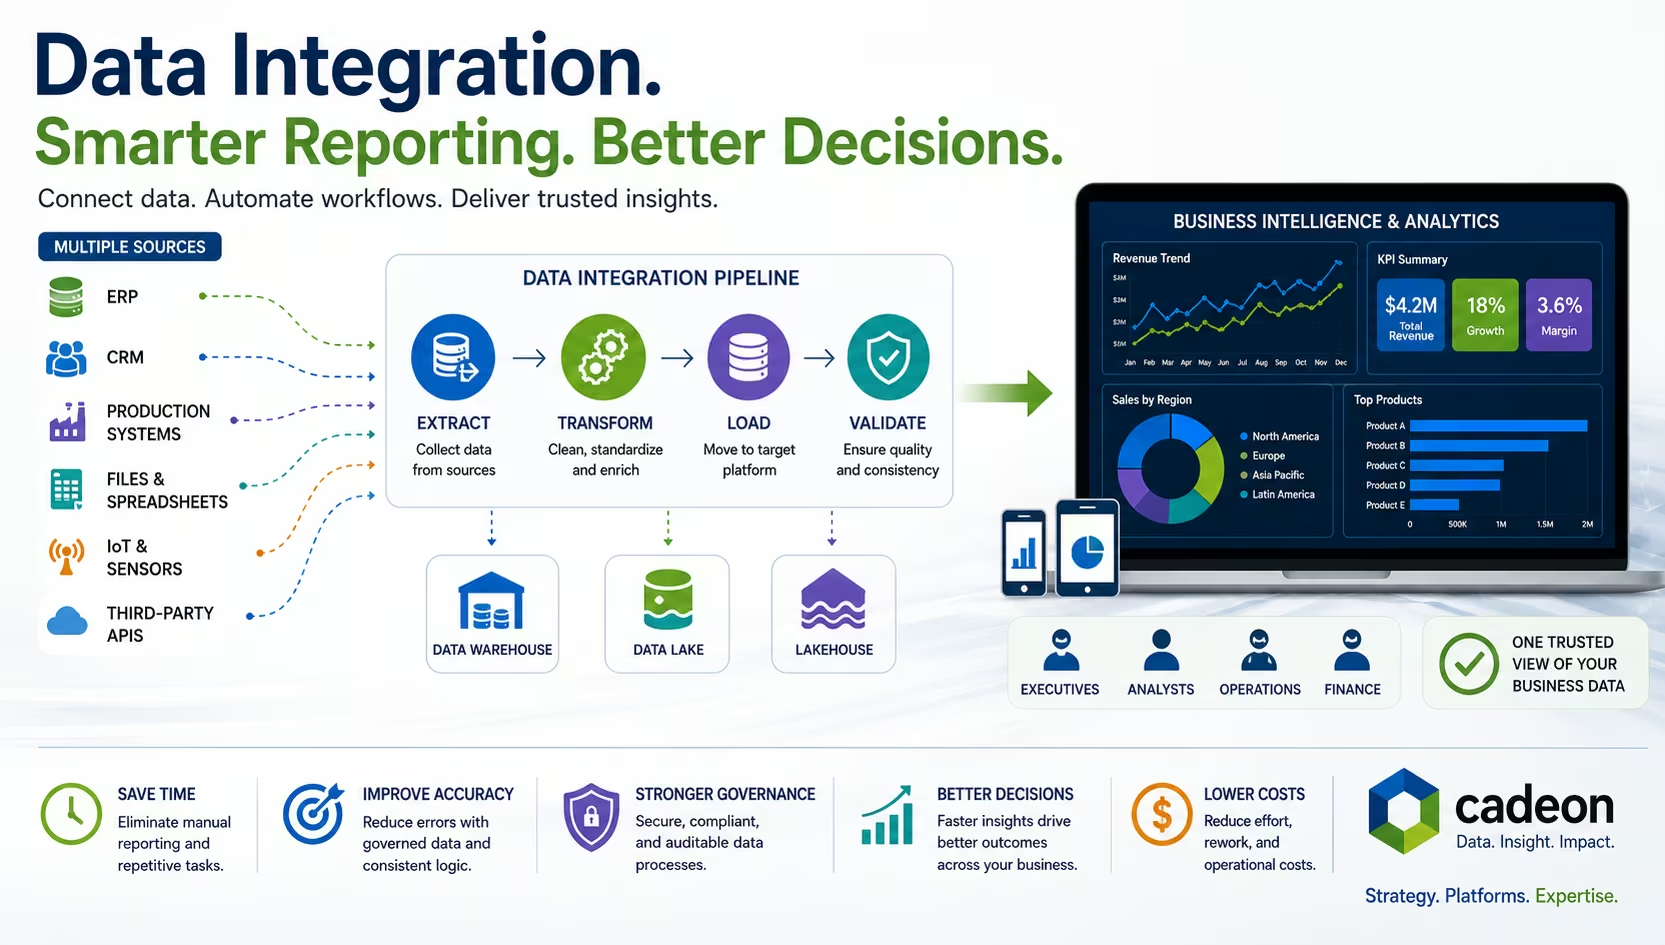
What Is Data Integration? Methods, Tools, and BI Explained
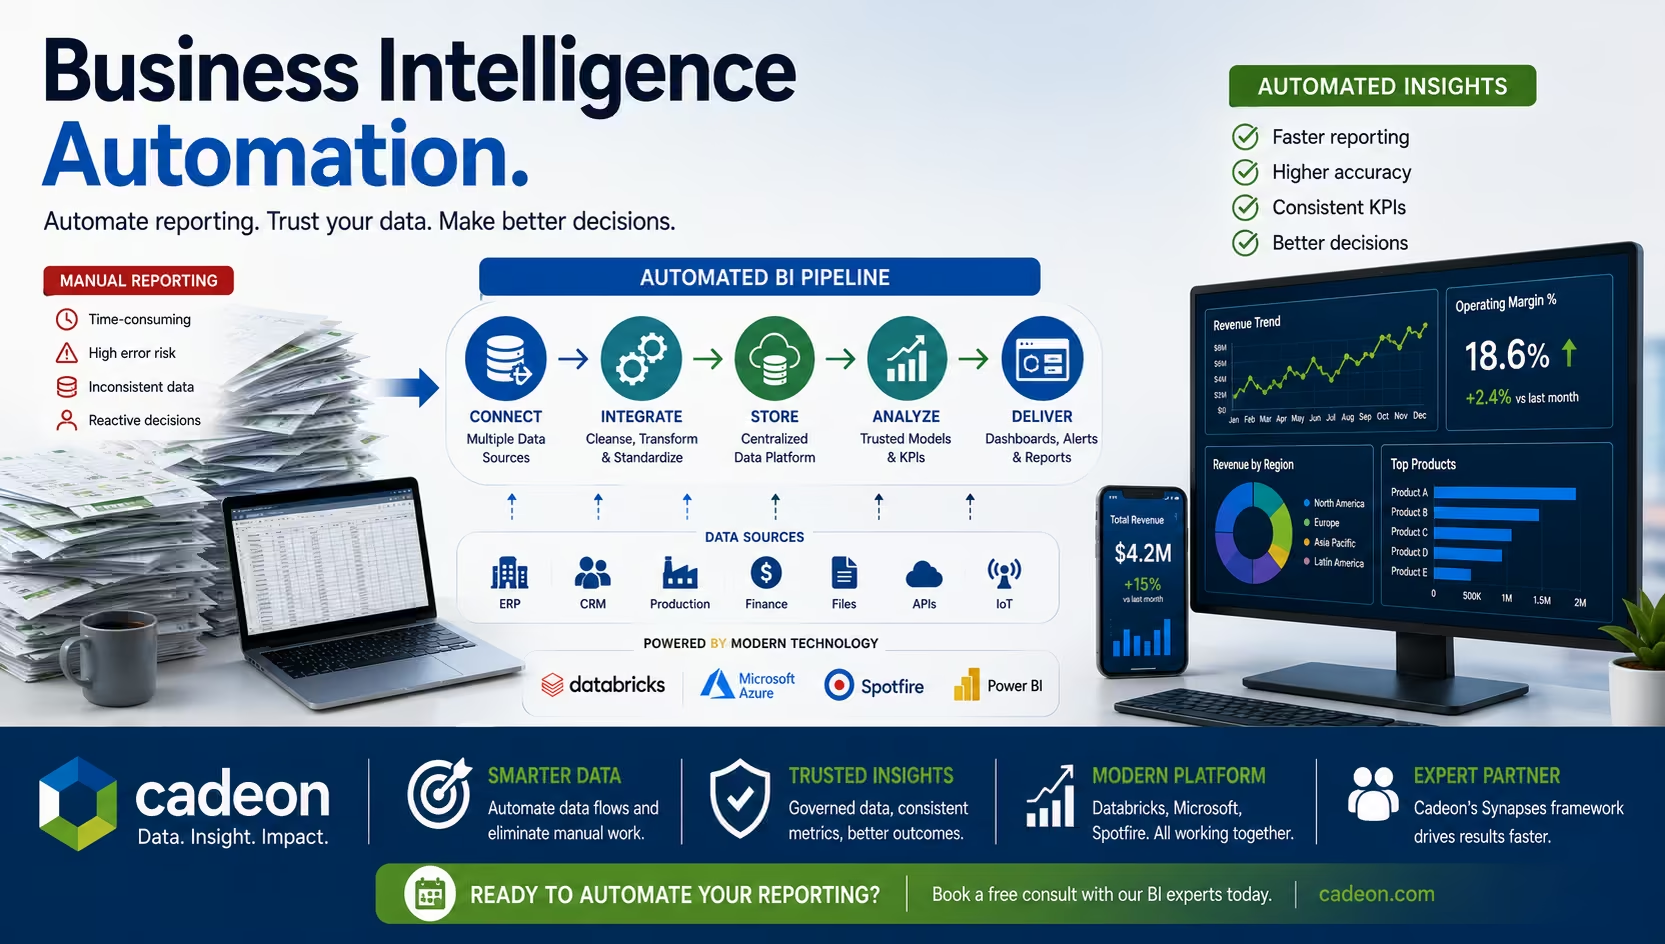
Business Intelligence Automation for Faster Reporting & Insights