
Manufacturing Analytics That CFOs Trust: Link OEE to Margin Leakage

Bringing finance and operations together around a shared, trusted view of manufacturing analytics.
If you're a manufacturing CFO, you've probably sat in meetings where the plant team swears the lines are humming, yet the P&L tells a different story. Dashboards flash bright green, margins slip, and you start to wonder if your data is working for you or against you. That tension is exactly where manufacturing analytics can either shine or fall flat.
In our work with finance and operations leaders, the pattern is familiar: plenty of charts, not enough confidence. The gap usually isn’t a lack of data; it’s a lack of governance and a clear line of sight from shop floor metrics like OEE to actual margin leakage in the income statement. Once that link is in place, the whole tone of those meetings changes.
In this article, you’ll see how to connect manufacturing analytics—especially OEE—to real margin leakage using governed Spotfire models your CFO can audit and trust.
TL;DR: What you’ll get from this article
- Why many CFOs don’t fully trust plant data, even with advanced manufacturing analytics in place.
- A practical way to connect OEE losses to real dollars of margin leakage.
- How governed TIBCO Spotfire models keep definitions, data sources, and calculations consistent.
- Concrete use cases that prove value fast, without another endless data project.
Manufacturing analytics FAQ for CFOs
What is manufacturing analytics for a CFO?
For a CFO, manufacturing analytics is a governed model that translates shop-floor events (like OEE losses, scrap, and downtime) into clear, auditable dollars of margin impact. It reconciles to the P&L, uses cost rates and assumptions finance signs off on, and lets you drill from plant KPIs down to their effect on contribution margin and conversion cost. For a broader primer, see this overview of manufacturing analytics explained.
How does big data in manufacturing help margin?
Big data in manufacturing only helps margin when detailed event data from historians, MES, and quality systems is combined with product, customer, and cost data. That integration lets you see which loss modes, product mixes, or shift patterns are driving the largest margin leakage, so you can focus capital, maintenance, and improvement projects where they have the biggest financial payoff.
How long does it take to see results?
Most organizations can stand up a first governed model and a handful of CFO-ready use cases—such as scrap and rework, chronic downtime on a bottleneck line, or a 1-point OEE scenario—within 60–90 days. The key is aligning finance and operations early on definitions, data sources, and how OEE events will be translated into dollars.
1. Why your CFO doesn’t fully trust plant data (yet)
When a plant manager says, “Our OEE is 88%,” a seasoned CFO instinctively asks, “Based on what?” That reaction isn’t skepticism for its own sake; it comes from years of seeing beautifully formatted reports fall apart under basic questions about scope, timing, and definitions.
The usual culprits show up again and again:
- Multiple versions of the truth – MES, ERP, and spreadsheets all tell slightly different stories.
- Shifting definitions – last month’s “planned downtime” isn’t quite the same as this month’s.
- Lack of financial tie-out – yield and scrap dashboards don’t reconcile to material variance in the general ledger.
- Opaque calculations – no one can easily walk through how a KPI was calculated, step by step.
In one client story, a North American manufacturer had three OEE numbers for the same line, depending on whether you asked maintenance, production, or finance. Until those views were reconciled inside a governed Spotfire model, every conversation about “improving performance” turned into a debate about whose spreadsheet was right.
If this sounds familiar, you’re not alone. Studies from firms like McKinsey research on manufacturing analytics and the World Economic Forum have highlighted that most digital and Industry 4.0 programs stall not on technology, but on trust and adoption. Broader research on digital transformations from firms such as McKinsey and BCG shows that only around 30% of large change programs fully achieve their targets and sustain the improvements, which helps explain why many CFOs approach new analytics initiatives with caution.
2. Connecting OEE to margin leakage: one language for finance and operations
OEE (Overall Equipment Effectiveness) is a fantastic operational lens, but on its own it doesn’t tell a CFO how many dollars just slipped through their fingers. To change that, OEE needs to be paired with a simple, shared structure for margin leakage.

Connecting OEE metrics to a clear picture of margin leakage helps manufacturing analytics resonate with CFOs.
A helpful way to think about this is an “OEE-to-margin ladder” that links each OEE loss bucket to a financial outcome:
| OEE component | Loss type | Example margin leakage |
|---|---|---|
| Availability | Unplanned downtime | Under-absorbed fixed overhead, late order penalties, and premium freight |
| Performance | Slow cycles, minor stops | Lost contribution margin from fewer good units per hour |
3.2. Guardrails, not handcuffsA good governed setup feels less like a locked vault and more like well-marked lanes on a highway. Engineers still have room to experiment in Spotfire dashboards and analysis files, but when something needs to become “official,” it moves into the governed layer with data stewardship and change control. “If finance can’t see where the number came from, it’s not governed.” That simple rule saves hours of debate every month and builds confidence that everyone is working from the same source of truth. 4. Turning big data in the manufacturing industry into a CFO-grade modelBig data manufacturing projects often begin with sensors, historians, and cloud platforms. The trouble is, that stack on its own can leave finance on the sidelines. To bring them in, we design the Spotfire model from the margin question backward. 4.1. Start with the questions finance actually asks
When those questions drive the model, big data and manufacturing stop feeling like separate worlds. The analytics design anchors to P&L concepts: contribution margin, conversion cost, and mix. 4.2. Map data flows from event to dollar
The result is a governed Spotfire data model where a CFO can click on a plant, drill down to a product family, and see not just tons or units lost, but estimated dollars and basis points of margin affected. This is where manufacturing-focused analytics stops being a reporting exercise and starts becoming an investment tool. For extra context, many organizations pair this with external benchmarks from groups like APQC or sector-specific benchmarking networks, so they can see how their losses stack up against peers. 5. A practical Spotfire architecture: from historians to the P&LGood architecture keeps the whole setup sustainable. You don’t want a hero analyst wiring everything together with brittle scripts. You want a pattern that IT, OT, and finance all understand. 5.1. A simple reference pattern
 A governed Spotfire architecture gives finance, IT, and operations a shared foundation for manufacturing analytics. With this pattern, you can plug in new data sources from big data and manufacturing pilots without rewriting every report. The finance-approved definitions stay in the semantic layer, not scattered across dozens of workbooks. 5.2. Governance checkpointsCadeon typically helps clients establish a few simple checkpoints:
These are the unglamorous pieces that make a governed model stick long after the first project is done. 6. Quick-win use cases that earn trust in 90 daysNot every CFO wants to wait a year for value. The good news: you don’t need a full digital overhaul to prove that governed analytics work. A few focused use cases usually do the trick.  Targeted, high-impact use cases on the plant floor demonstrate the value of CFO-ready manufacturing analytics quickly. 6.1. Scrap and rework with a dollar lensStart with a single plant and a handful of high-volume SKUs. Build a Spotfire view that shows scrap and rework events, ranked by estimated margin leakage. Then sit down with finance and ask a simple question: “Does this match what you see in the variance reports?” When the answer is “yes,” you’re on the right track. 6.2. Chronic downtime on a constrained lineEvery manufacturer has at least one notorious bottleneck. Use your governed OEE model to list the top 10 recurring downtime causes on that line and quantify the associated lost contribution margin. This often uncovers relatively modest changes in setup, maintenance, or planning that pay back quickly. 6.3. What does a 1-point OEE gain really mean?Here’s where big data and manufacturing come together with finance. Build a simple scenario page: “If this line improves OEE by 1 point, at current mix and pricing, here’s the estimated impact on annual margin.” When that number is visible and trusted, capital requests and improvement projects land very differently in budget conversations. Benchmarks from Industry 4.0 programs in high-volume manufacturing suggest why: combining disciplined lean practices with advanced analytics has delivered 30–50% gains in direct-labour productivity and 10–15 percentage-point improvements in OEE in some plants, alongside yield gains of 1–3 percentage points. Even a small, trusted increase on your constrained lines can translate into meaningful, CFO-visible margin uplift. To keep the effort manageable, many clients use our $10K Digital Transformation Challenge format to structure these first 90 days and prove value on a contained scope. For a documented example of how this kind of governed, loss-focused analytics works in another asset-intensive industry, see Cadeon’s Spotfire-based loss management solution for oil and gas in our loss management case study. The same pattern—standardizing loss events, aligning financial KPIs, and delivering a single, trusted dashboard—maps directly to manufacturing plants. 7. How Cadeon helps you build CFO-ready manufacturing analyticsCadeon has worked with manufacturers across North America who were swimming in data but short on insight. The ones who succeeded did a few things consistently well: they aligned finance and operations on definitions, invested in governed models, and gave teams the skills to keep improving them. With our Spotfire-focused services and Synapses framework, we typically help clients:
If you’re wondering where to start, a brief conversation can help pinpoint the fastest path to a single, trusted view of OEE and margin leakage across your plants. Book a free consult to explore how a governed Spotfire model could support your next round of budget and capital decisions. Key takeaways
Ready to transform your data strategy?You might also like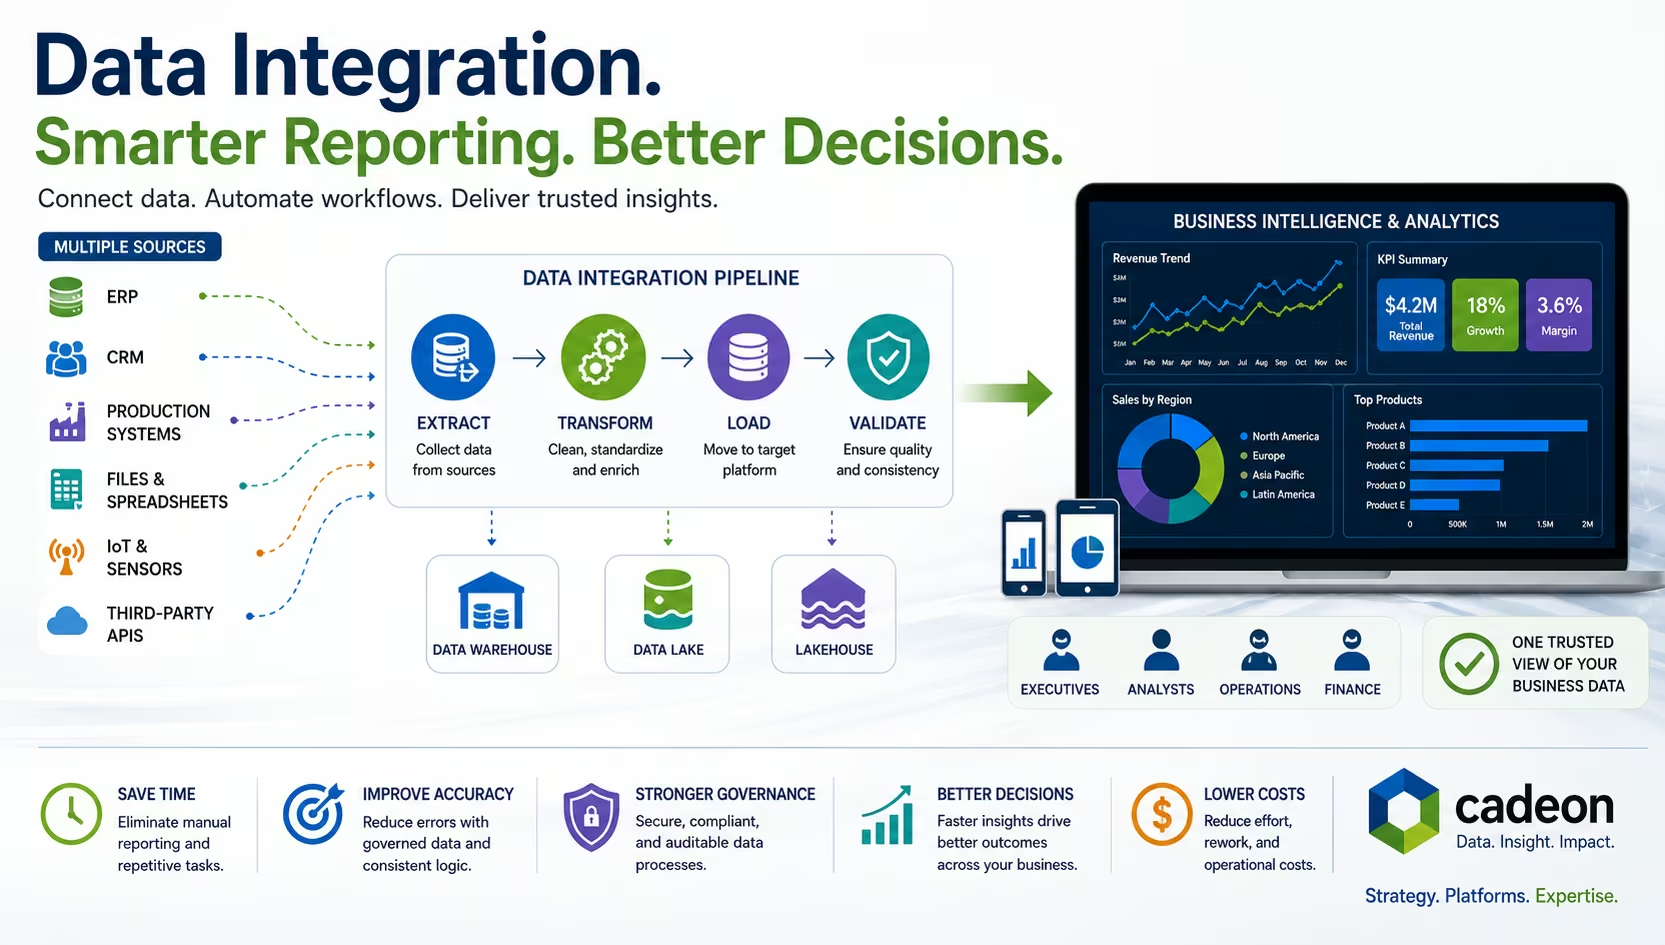 What Is Data Integration? Methods, Tools, and BI Explained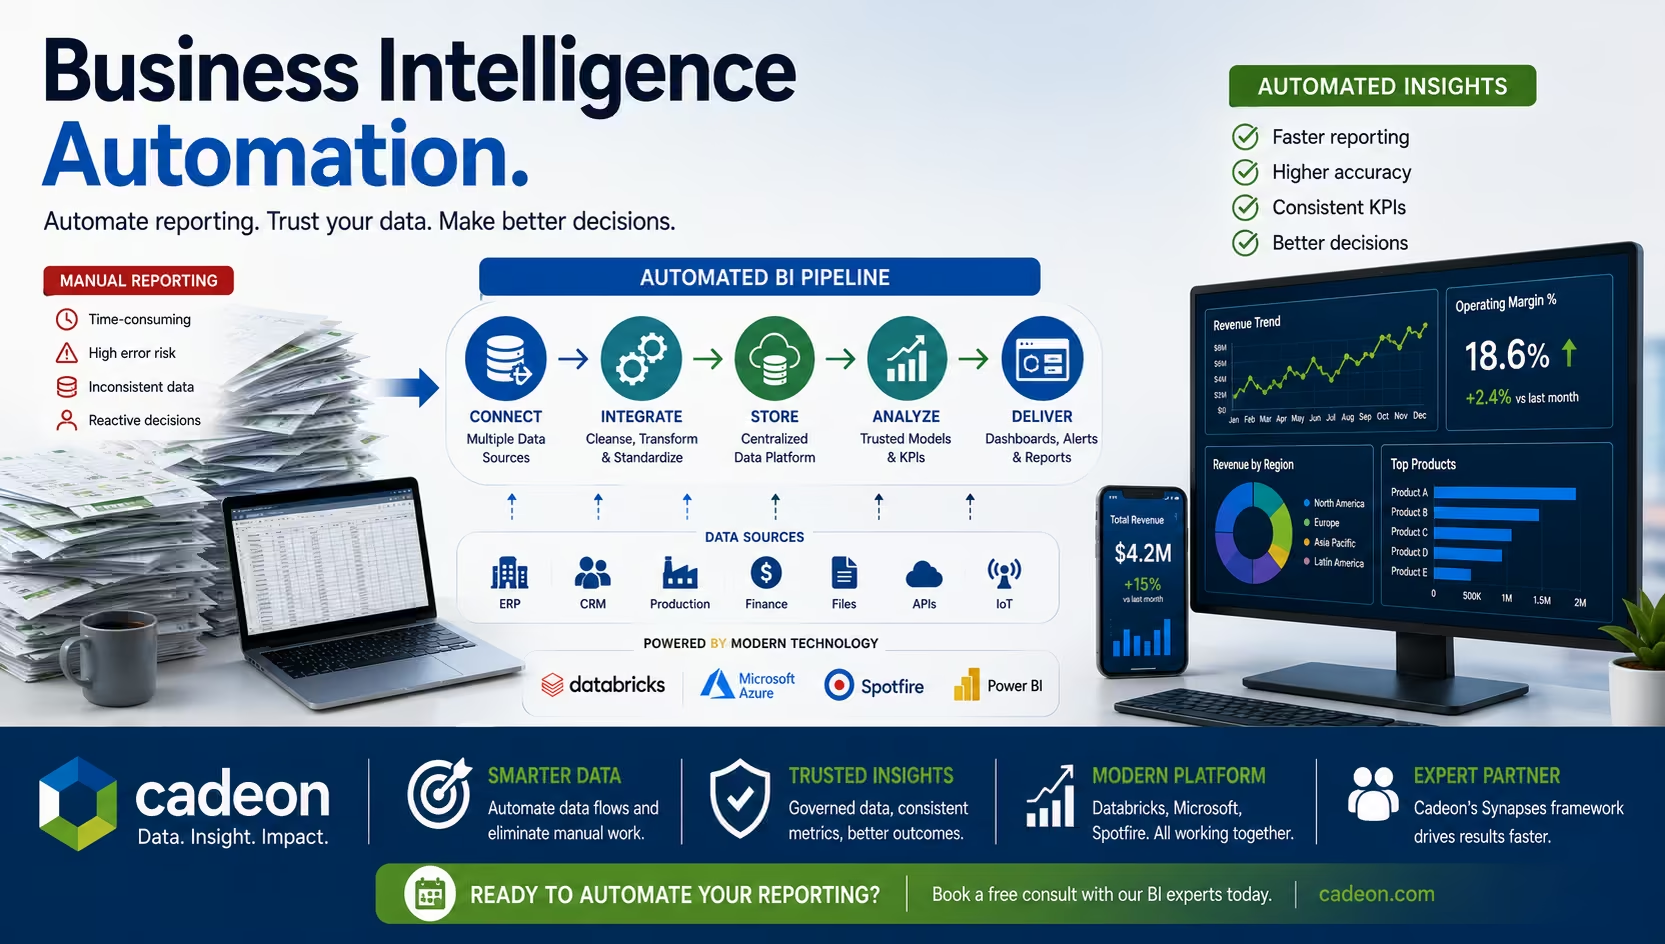 Business Intelligence Automation for Faster Reporting & Insights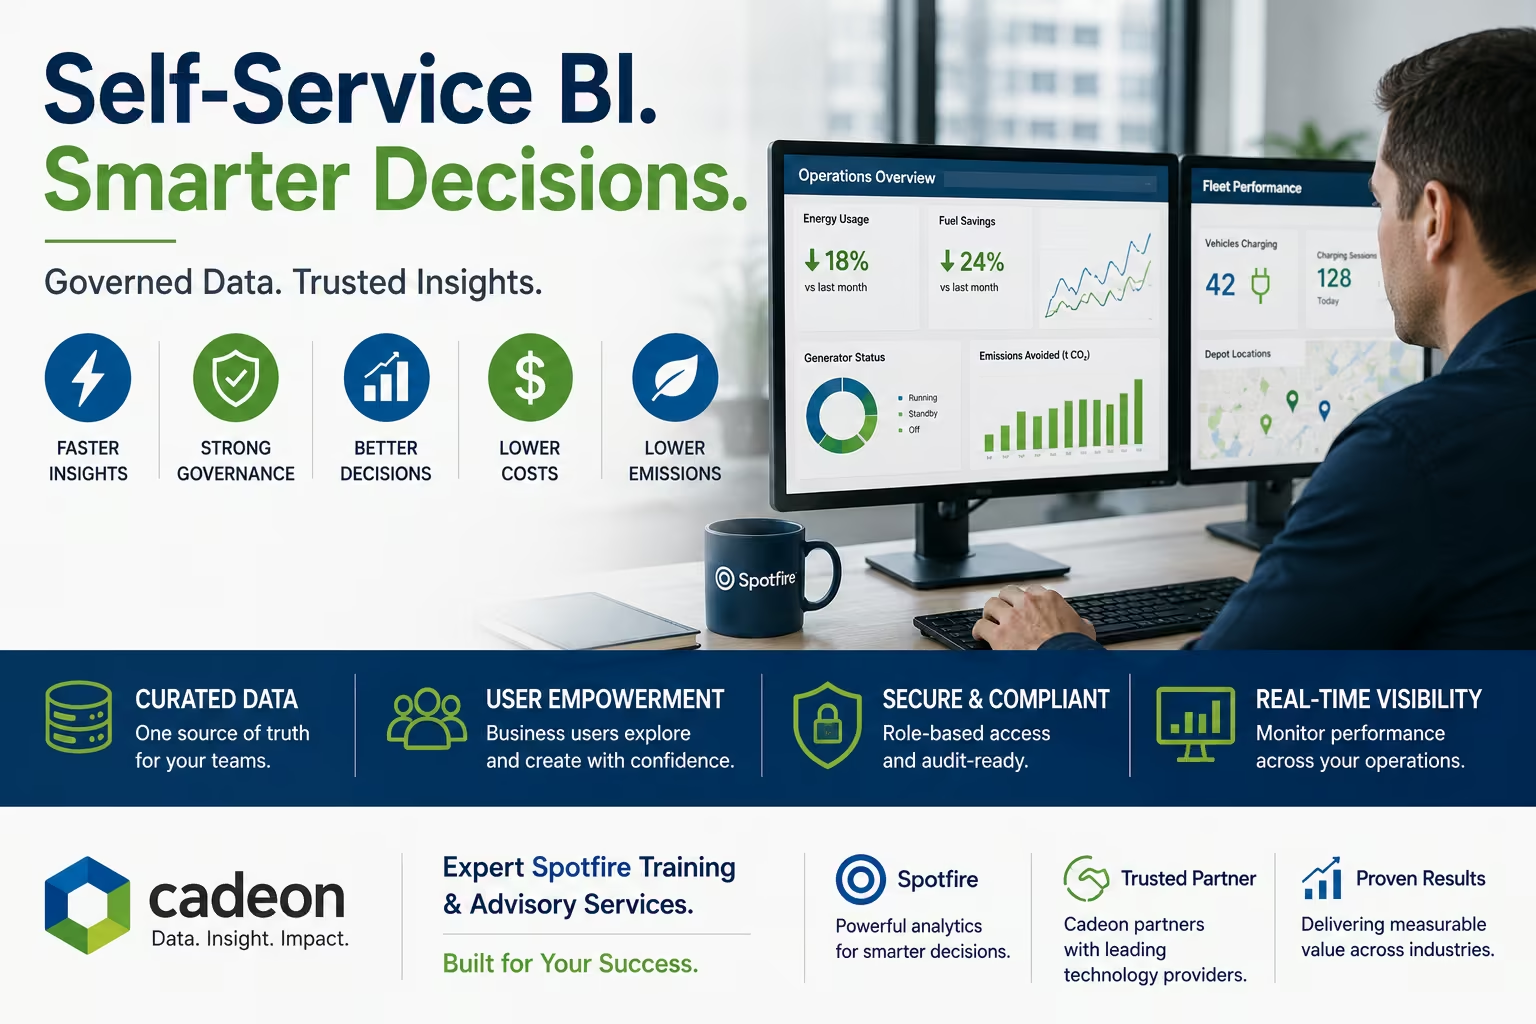 Self-Service BI Governance Tips and Self Service BI Tools Guide |